

[ad_1]
The Pepe (PEPE) coin price has been on a tear over the past seven days, breaking out from a long-term diagonal resistance line in the process.
During the increase, a whale bought 3.43 trillion PEPE coins. Previously, the same whale had made two big PEPE trades. He won $11.47 million the first time but lost $741,000 the second one. It remains to be seen whether this new trade will succeed.
PEPE Coin Price Bounces at Crucial Support Level
The Pepe coin has fallen since its all-time high price of $0.0000044 on May 5. The decrease has been swift, leading to a low of $0.0000008 on June 10.
The price bounced afterward, creating a long lower wick and validating the $0.0000008 horizontal area as support. PEPE has moved upwards since, accelerating its rate of increase on July 21.

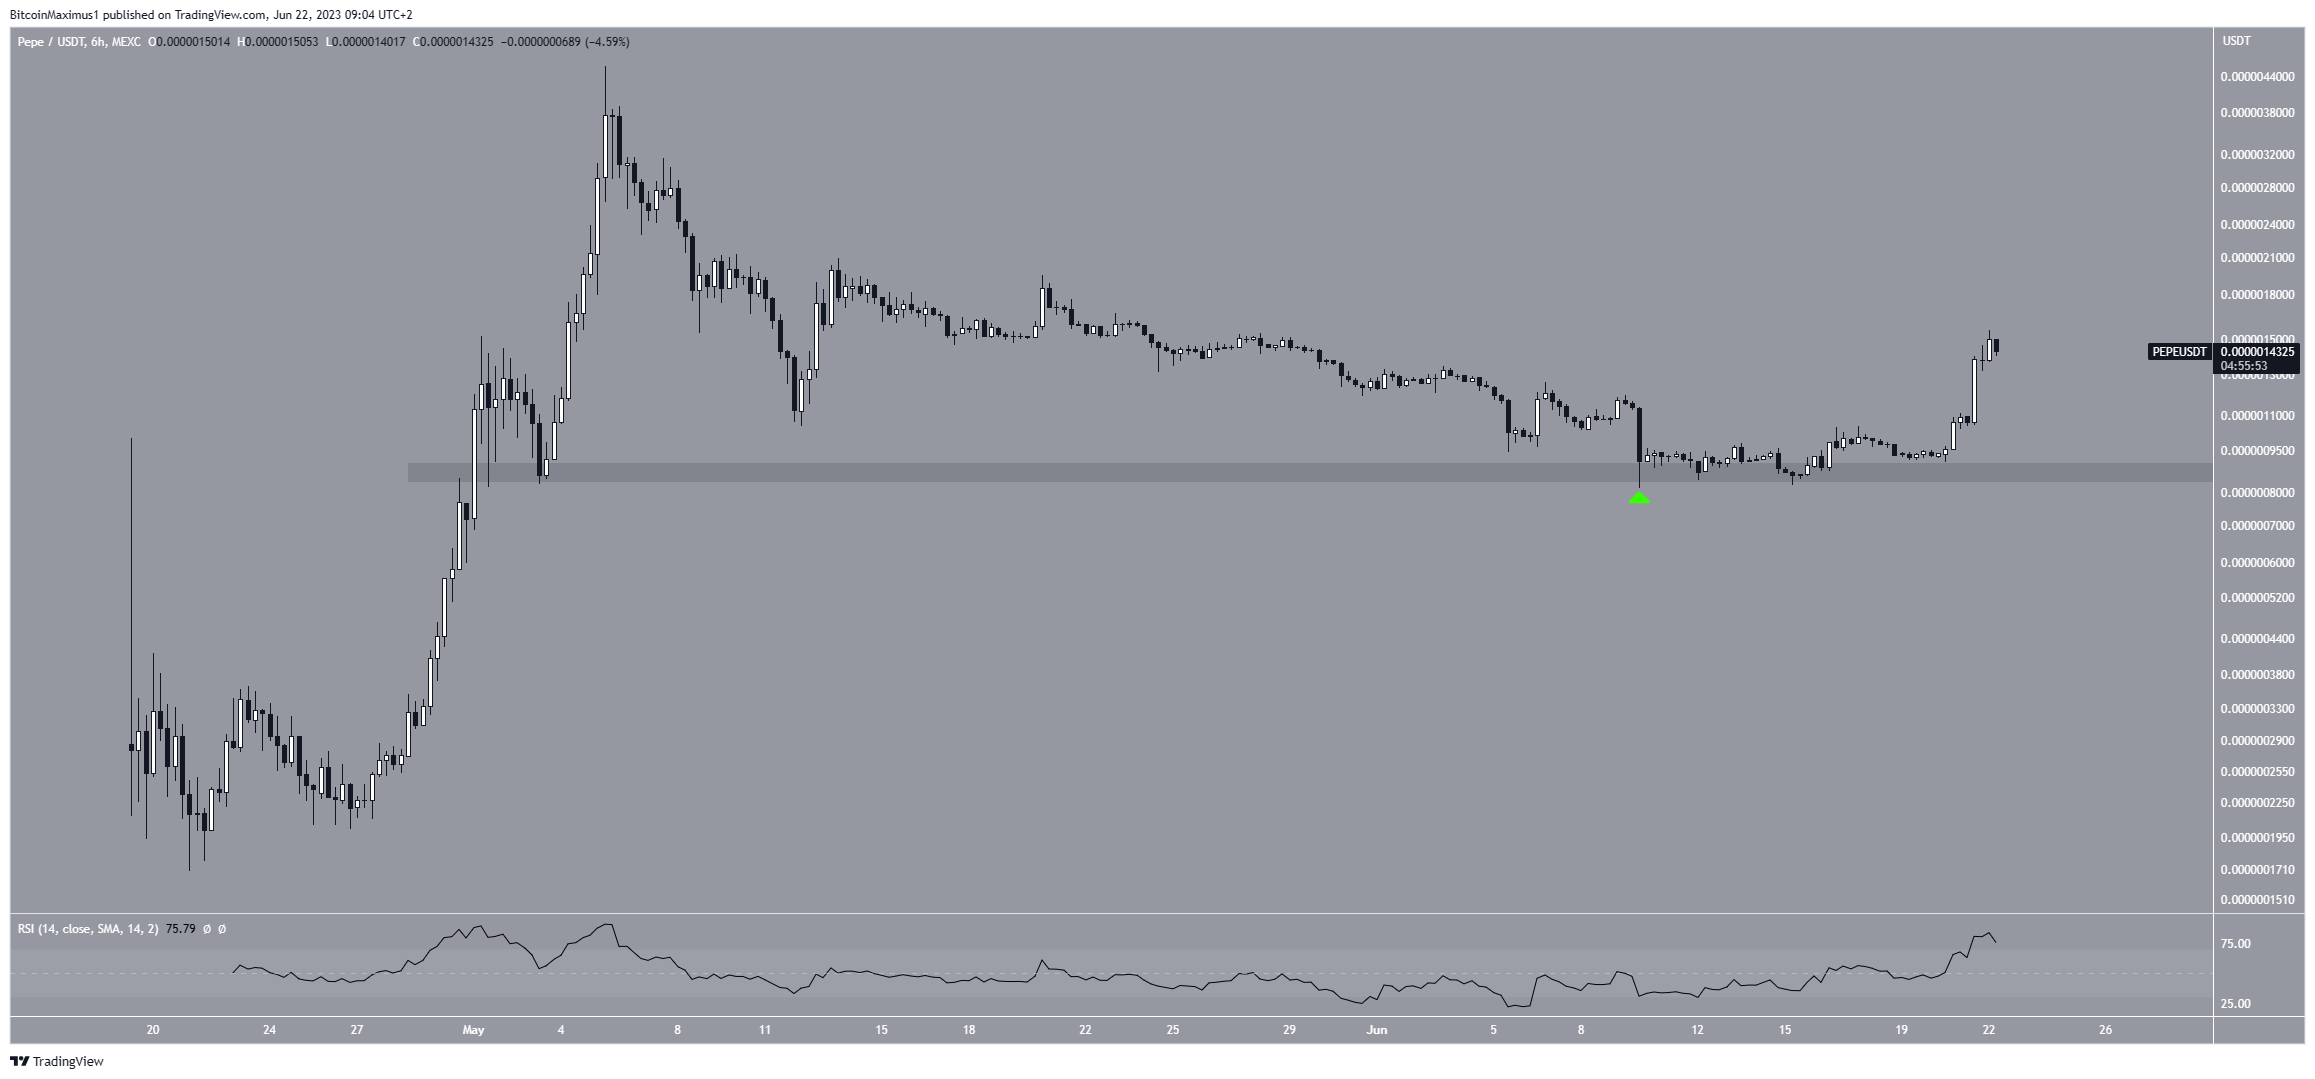
The Relative Strength Index (RSI) gives mixed readings. By using the RSI as a momentum indicator, traders can determine whether a market is overbought or oversold and decide whether to accumulate or sell an asset.
Bulls have an advantage if the RSI reading is above 50 and the trend is upward, but if the reading is below 50, the opposite is true. The RSI is above 50 and increasing. At first glance, this does look like a bullish signal.
However, the RSI has reached its overbought territory above 75. This means that the rally could reach a temporary top.
PEPE Price Prediction: Has a Reversal Begun?
The technical analysis from the short-term four-hour chart provides a more bullish PEPE coin price prediction. This is because of both the Elliott Wave theory and the price action.
The wave count shows that the PEPE price began a new five-wave increase on June 15. If the count is correct, the price is currently nearing the top of wave three (white). Thus, the upward movement can continue to the next resistance at $0.0000021 after a brief drop.
Next, the price broke out from a descending resistance line that had existed since May 13. This further supports the possibility that a new upward movement has begun.
The green icon indicates the candlestick in which the aforementioned whale entered his trade. It is interesting to note that the purchase did not precede the price breakout. Rather, it was made well after the PEPE price had cleared the diagonal resistance.
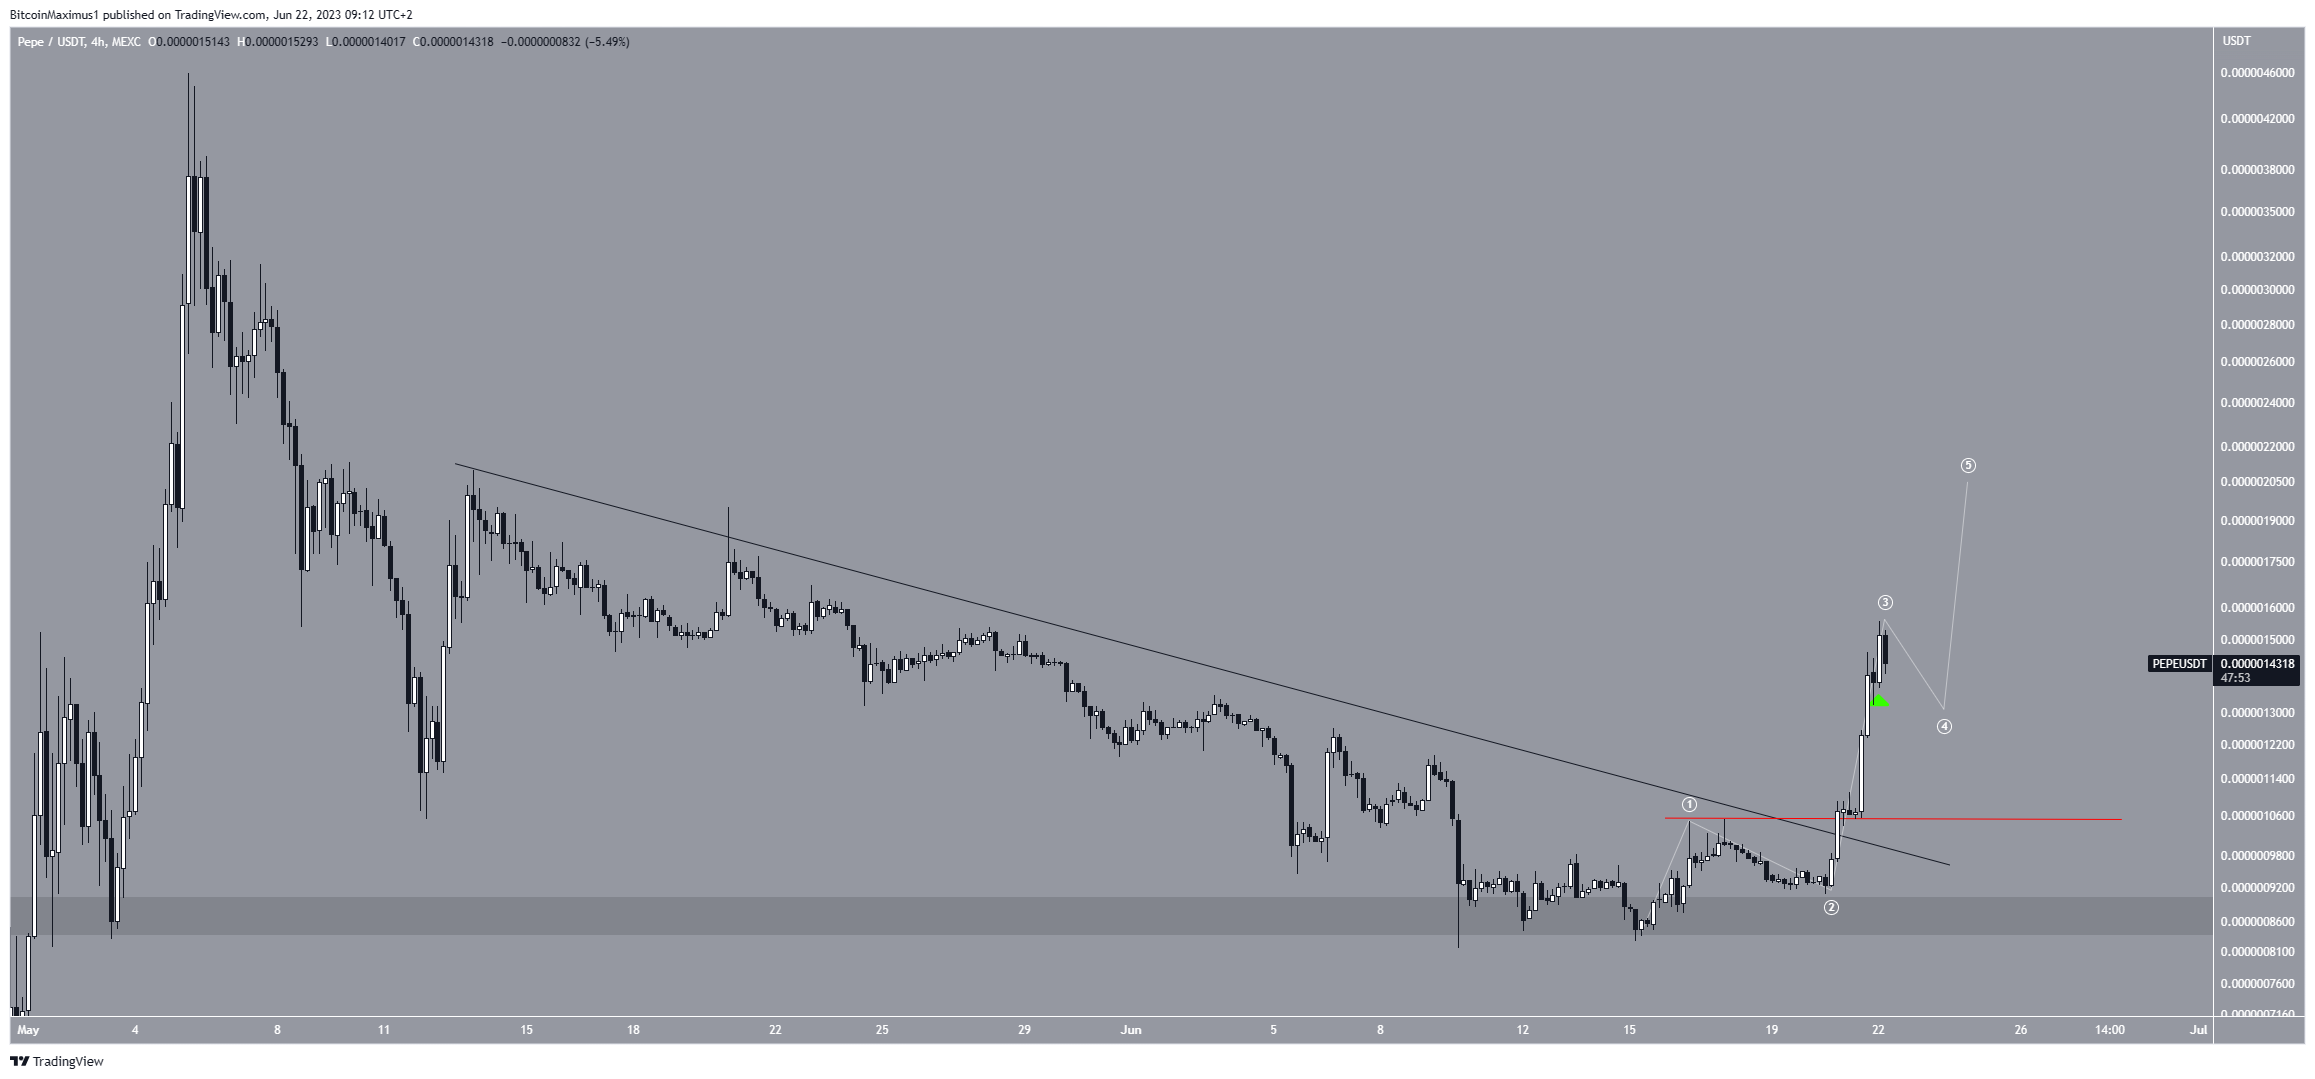
Despite this bullish PEPE price prediction, a fall below the wave one high (red line) at $0.0000010 will mean that the trend is bearish. In that case, the PEPE price will be expected to break down from the $0.0000008 area and fall to $0.0000005.
For BeInCrypto’s latest crypto market analysis, click here.
Disclaimer
In line with the Trust Project guidelines, this price analysis article is for informational purposes only and should not be considered financial or investment advice. BeInCrypto is committed to accurate, unbiased reporting, but market conditions are subject to change without notice. Always conduct your own research and consult with a professional before making any financial decisions.
[ad_2]
Source link