
 Price Recovery: Risks After 30% Gain?")

[ad_1]
The Solana (SOL) price has decreased since failing to reclaim a critical resistance level on June 22.
Readings from multiple sources and time frames suggest that more downside is likely until the Solana price reaches a bottom.
Solana Falls After Retesting Previous Support
The technical analysis of SOL using the daily time frame reveals a decline in price starting from April 17. On June 4, Solana experienced a lower high before intensifying its downward momentum. This resulted in a low of $12.80 on June 10
The significance of this decline lies in the breach of the $17 support level, which had been holding since the beginning of the year. The SOL price retested the level on June 22 and has fallen since. At first glance, this looks like a regular breakdown and retest, after which another drop is expected.
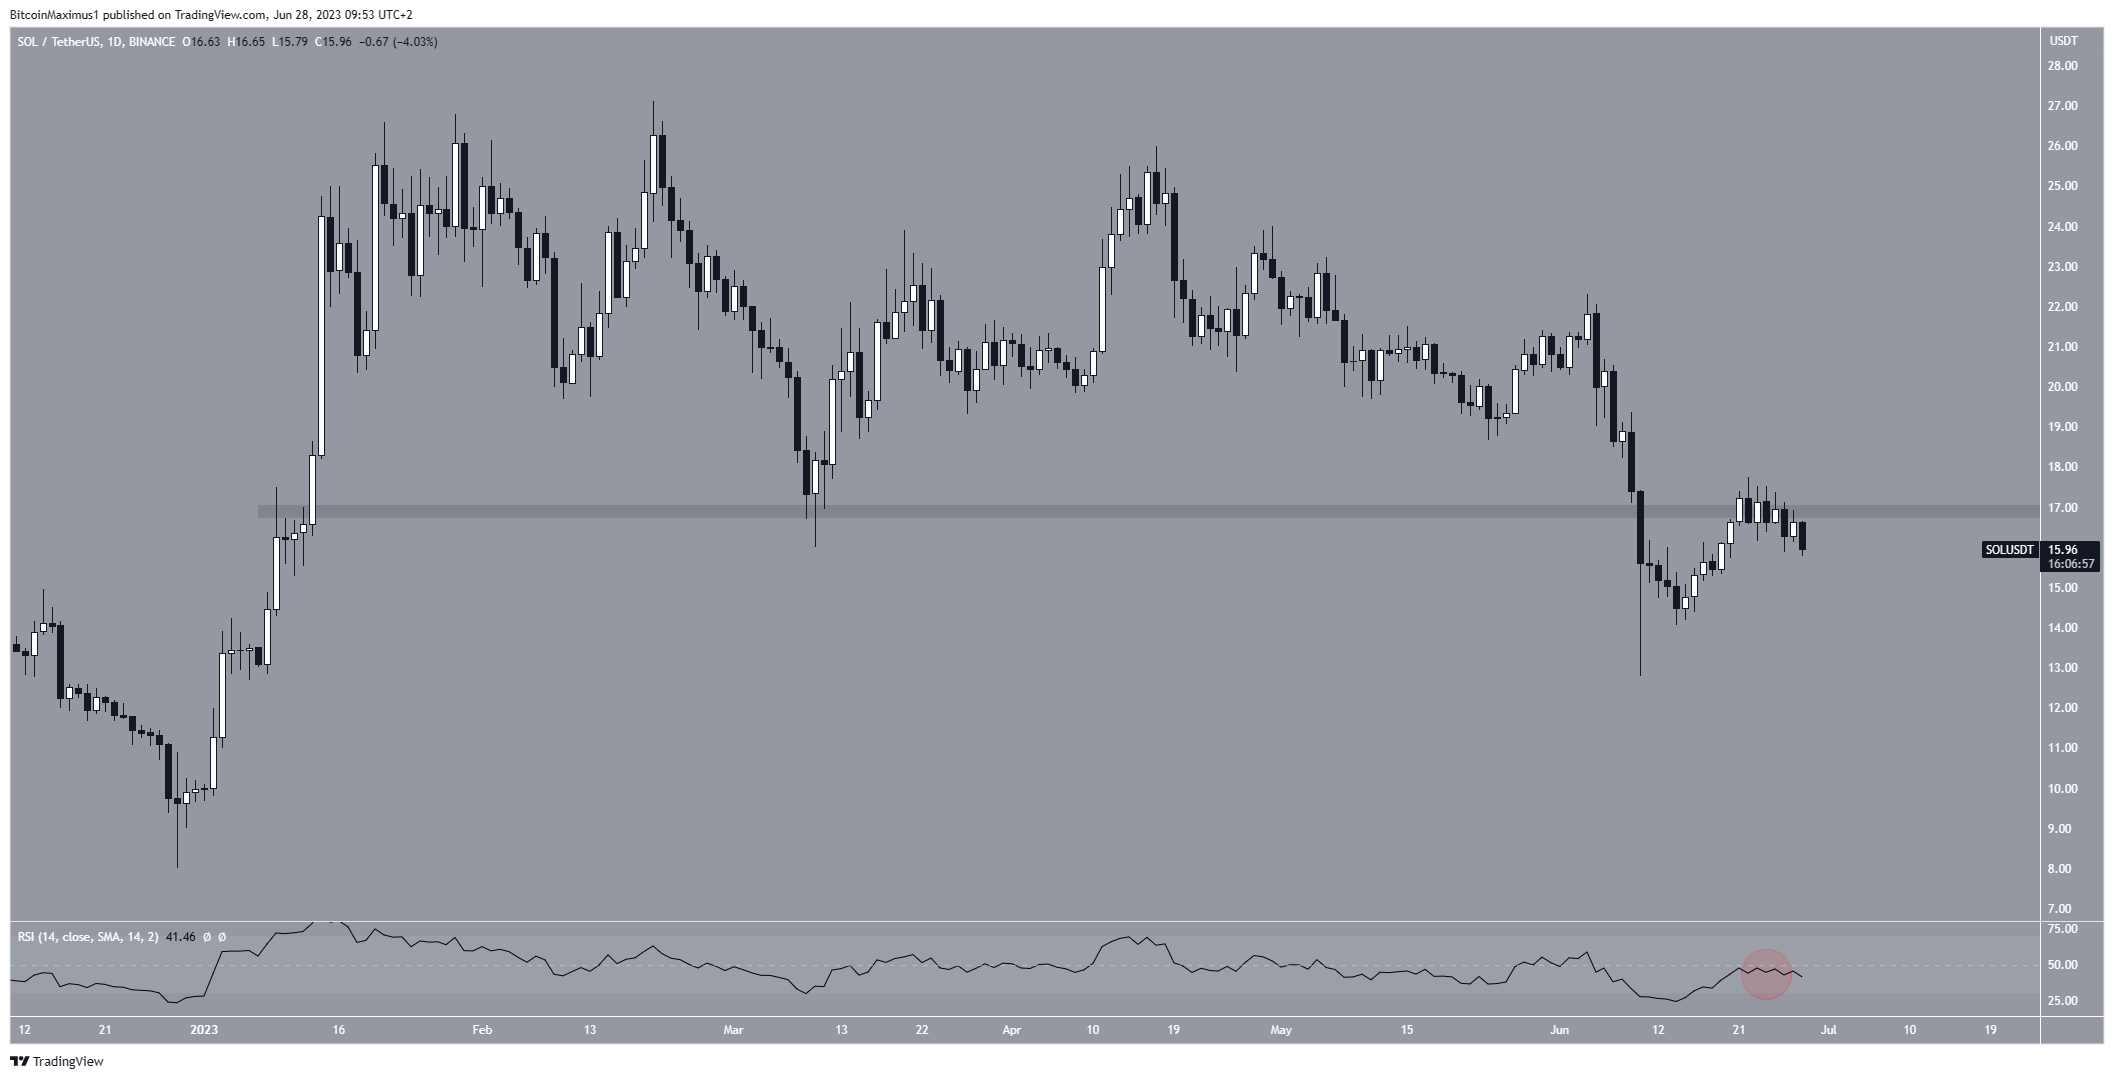
Analyzing the weekly Relative Strength Index (RSI) yields a bearish signal. RSI is a momentum indicator used by traders to assess whether a market is overbought or oversold.
Readings above 50 and an upward trend indicate a bullish advantage, whereas readings below 50 suggest the opposite. The RSI was rejected by the 50 line (red circle) and is currently falling. This aligns with the price rejection and supports the continuation of the decrease.
SOL Price Prediction: When Does Wave Count Predict Bottom?
Remaining within the daily time frame, the analysis of wave patterns suggests an anticipated continuation of downward movement. Technical analysts employ the Elliott Wave theory, which examines long-term price patterns and investor psychology to determine the trend direction.
Based on the wave count, it appears that the price has reached the peak of wave four within a five-wave downward movement (depicted in black). This notion is supported by the price trading at a convergence of resistance levels, both horizontally and diagonally.
If the wave count is accurate, the SOL price will decline to $9.72. This target is derived from the 1.61 external Fibonacci retracement of wave four (white).
Fibonacci retracement levels operate on the principle that after a significant price change in one direction, the price will retrace or revisit a previous price level before resuming in its original direction.
Additionally, they can be employed to identify the lowest point of future downward movements.
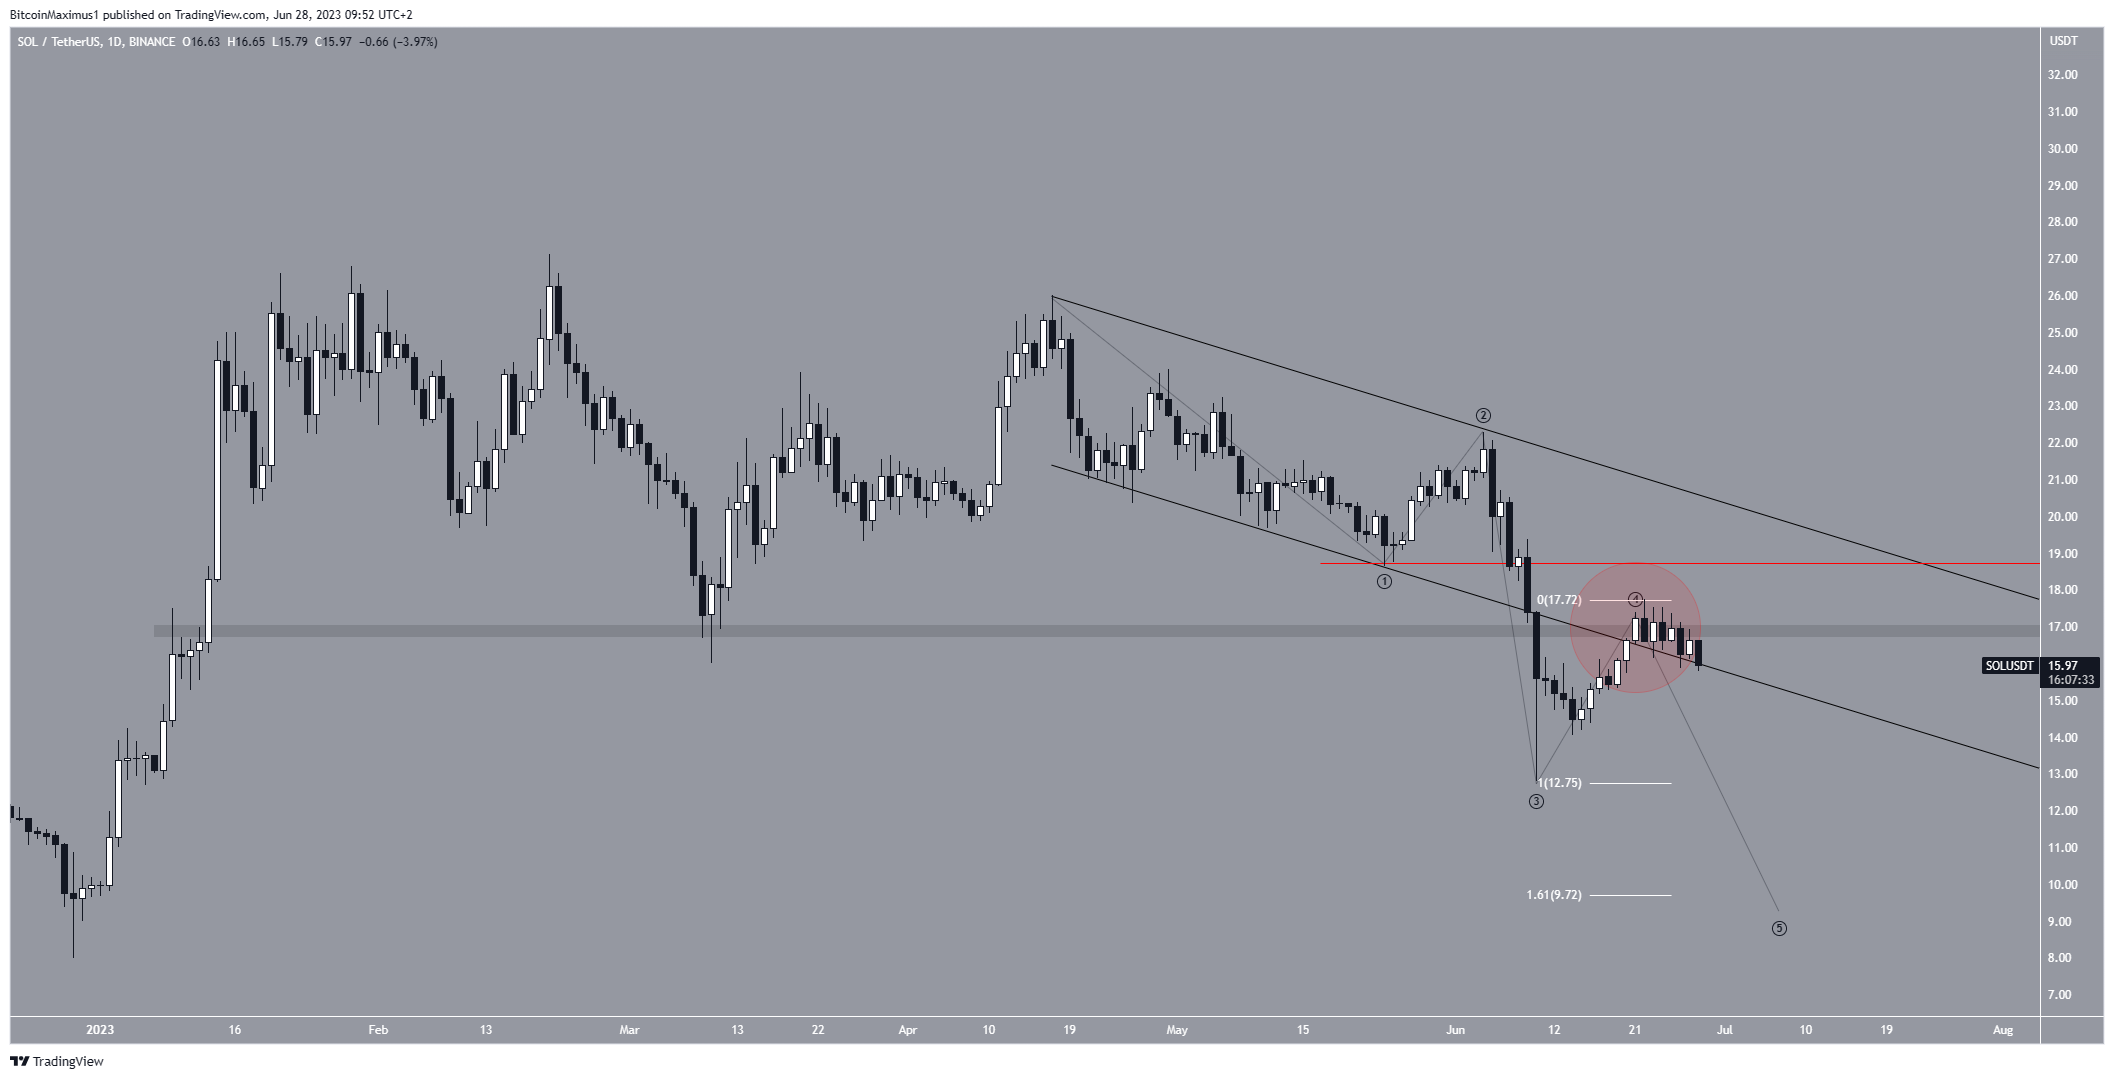
However, it’s worth noting that if the price moves above the low of wave one (red line) at $18.72, it would indicate a bullish trend instead.
In such a scenario, the SOL price could potentially reach the next resistance level at $23.
For BeInCrypto’s latest crypto market analysis, click here.
Disclaimer
In line with the Trust Project guidelines, this price analysis article is for informational purposes only and should not be considered financial or investment advice. BeInCrypto is committed to accurate, unbiased reporting, but market conditions are subject to change without notice. Always conduct your own research and consult with a professional before making any financial decisions.
[ad_2]
Source link