
 Price at Risk: Potential Sell-off Looms")

[ad_1]
The Cardano (ADA) price initially broke down from a critical horizontal support area but finally reclaimed it after numerous failed attempts.
The readings from the weekly and daily time frames suggest that the ADA price has begun a long-term bullish reversal that will continue in the near future.
Cardano Cannot Sustain Increase – Falls to Support Instead
The technical analysis conducted on ADA for the weekly timeframe reveals that the ADA price experienced a breakout from a long-standing descending resistance line in early January. This resistance line had been in place for over a year, so a breakout was anticipated to result in a significant upward movement.
However, contrary to expectations, the ADA price returned to the descending resistance line two times after the breakout. This retracement validated the line as a support level both times (green icons). The second rejection also marked a new yearly low.

The most recent validation occurred on June 15 and coincided with a rebound at the $0.25 horizontal support area. Presently, the ADA price is trading slightly above this horizontal support area.
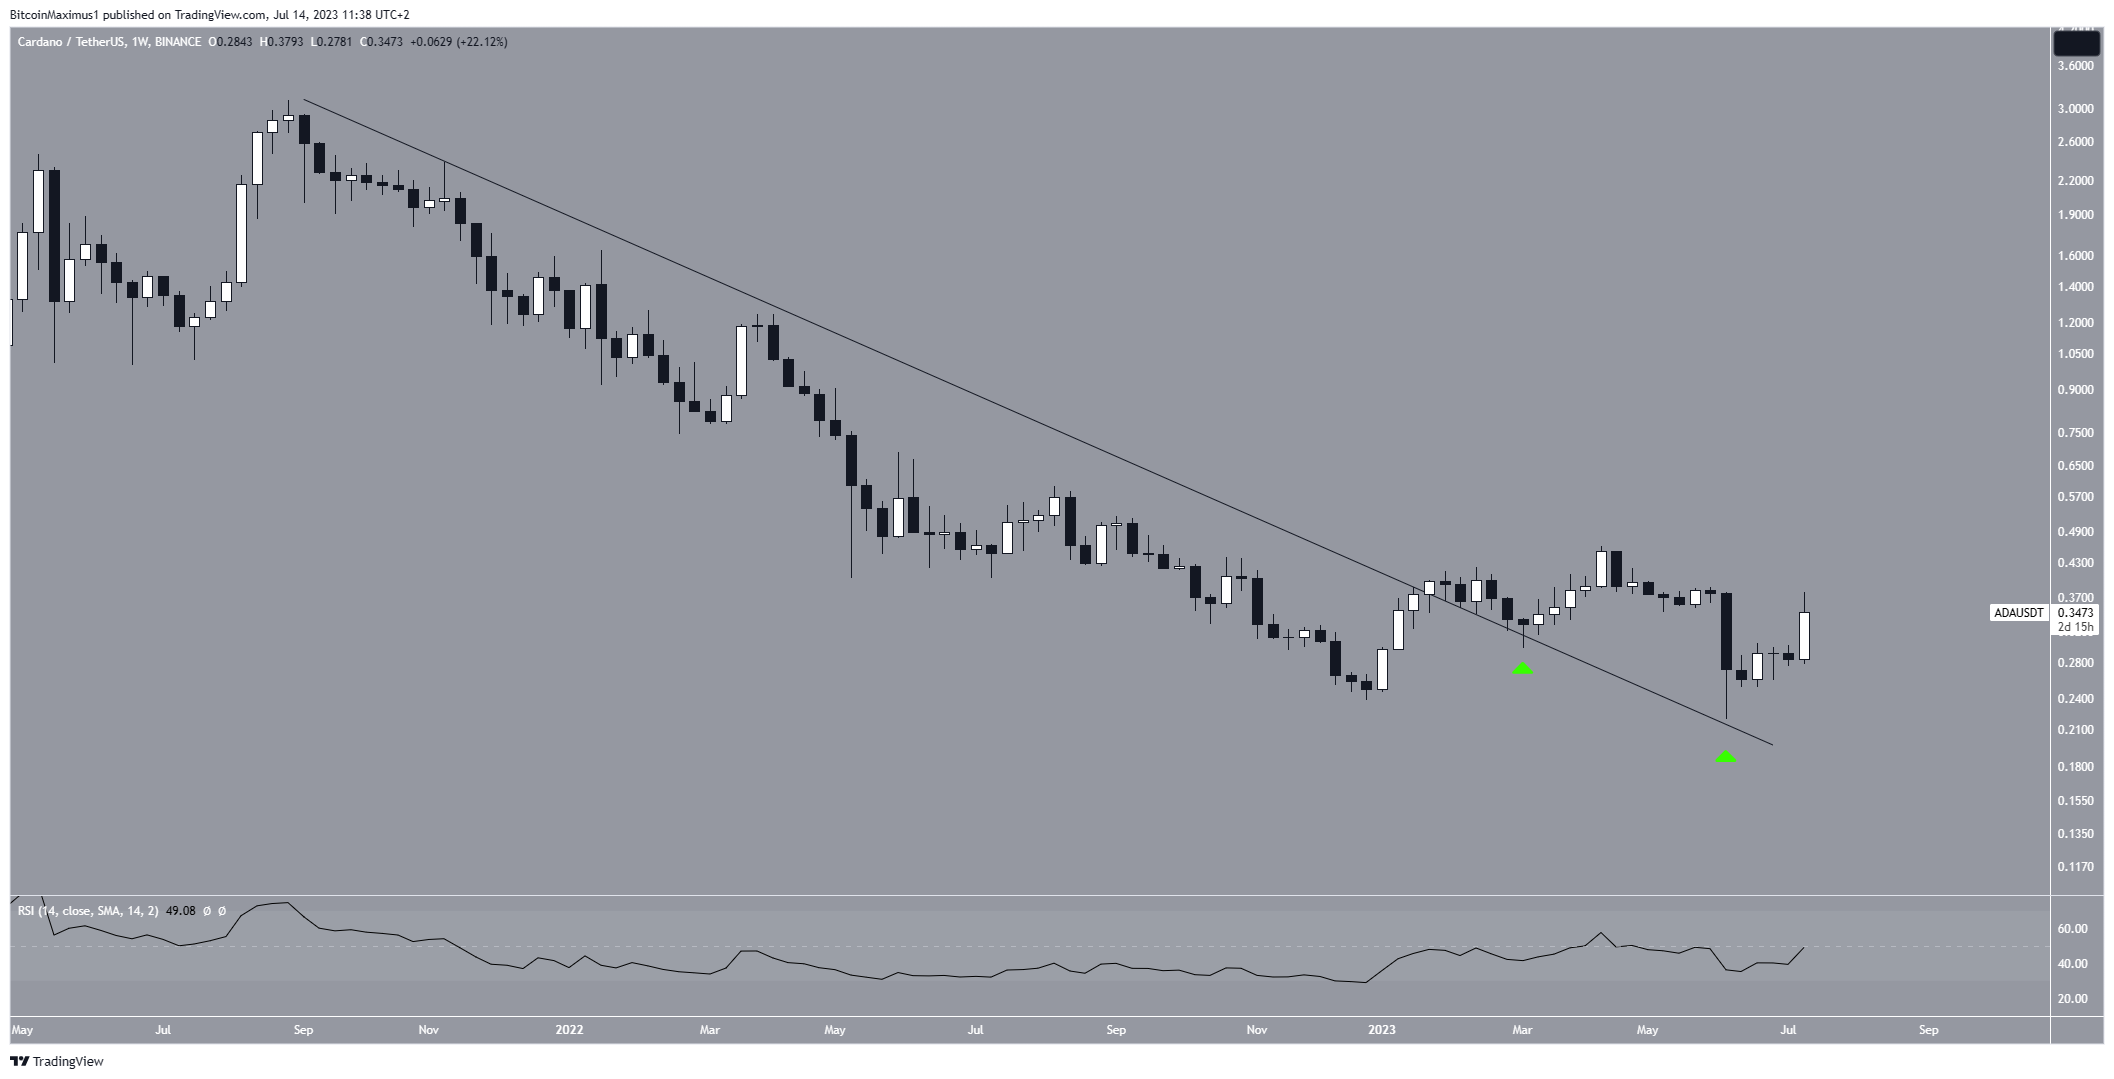
The weekly Relative Strength Index (RSI) provides an inconclusive reading. Traders utilize the RSI as a momentum indicator to determine whether a market is overbought or oversold and to make decisions about accumulating or selling an asset.
If the RSI reading is above 50 and the upward trend indicates that bulls still hold an advantage. Conversely, if the reading falls below 50, the opposite holds true.
Despite the RSI increasing, it remains below 50, suggesting an undetermined trend.
ADA Price Prediction: Will Breakout Continue?
A closer look at the daily timeframe price action shows a bullish outlook for the ADA price. There are several reasons for this.
Firstly, the price action shows that ADA broke out from a short-term descending resistance line. The line had previously been in place since April 13. So, its breakout is a decisive bullish sign.
Secondly, the price reclaimed the $0.29 area. The fact that it did so after a failed breakdown aligns with the breakout from the resistance line.
Finally, the daily RSI is above 50 and increasing.
However, it is worth mentioning that the $0.38 resistance area rejected the price and is in the process of creating a bearish candlestick. But several hours are left until the daily close, so the price can reverse its short-term decrease and move above $0.38.
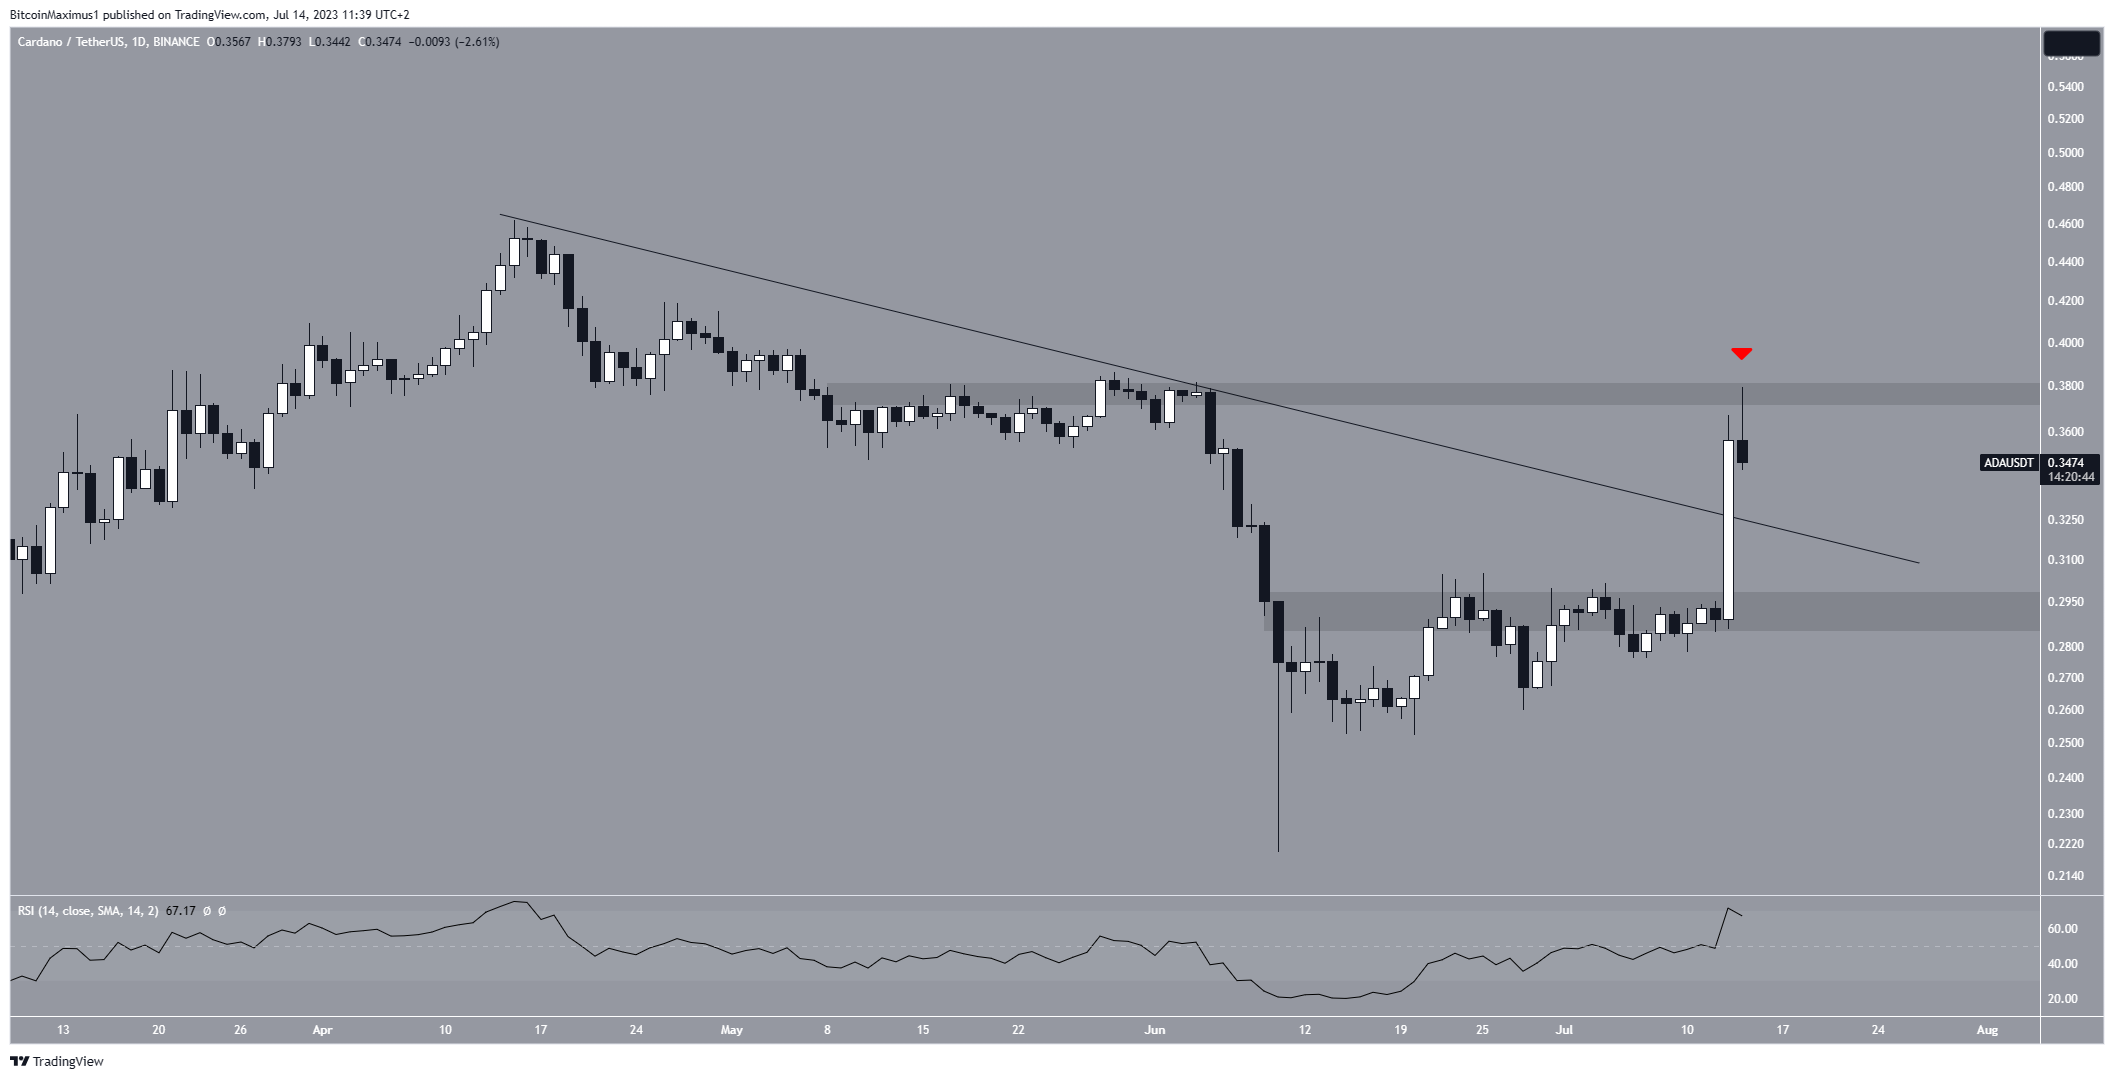
Despite this bullish ADA price prediction, failure to close above the $0.38 resistance area could lead to another drop to the $0.29 support level.
For BeInCrypto’s latest crypto market analysis, click here.
Disclaimer
In line with the Trust Project guidelines, this price analysis article is for informational purposes only and should not be considered financial or investment advice. BeInCrypto is committed to accurate, unbiased reporting, but market conditions are subject to change without notice. Always conduct your own research and consult with a professional before making any financial decisions.
[ad_2]
Source link