
 Price Breakout: Bullish Signal for Investors?")

[ad_1]
The price of Solana (SOL) has successfully surpassed significant resistance levels, both diagonally and horizontally, indicating a breakout. This breakout suggests that a new bullish trend reversal has likely commenced.
The price movement and various indicators provide further evidence to support the ongoing upward trend, increasing the probability that the SOL price will continue to rise in the near future.
Solana Price Clears 600-Day Resistance Line
An analysis of the weekly time frame shows that SOL had a significant breakthrough two weeks ago when it surpassed a descending resistance line that had been in place since November 2021, spanning over a period of 600 days.
Breakouts of this nature often signal the end of the previous trend and the beginning of a new trend in the opposite direction. So, the SOL price has likely initiated a bullish trend reversal. The four bullish candlesticks since the June lows further support this possibility.

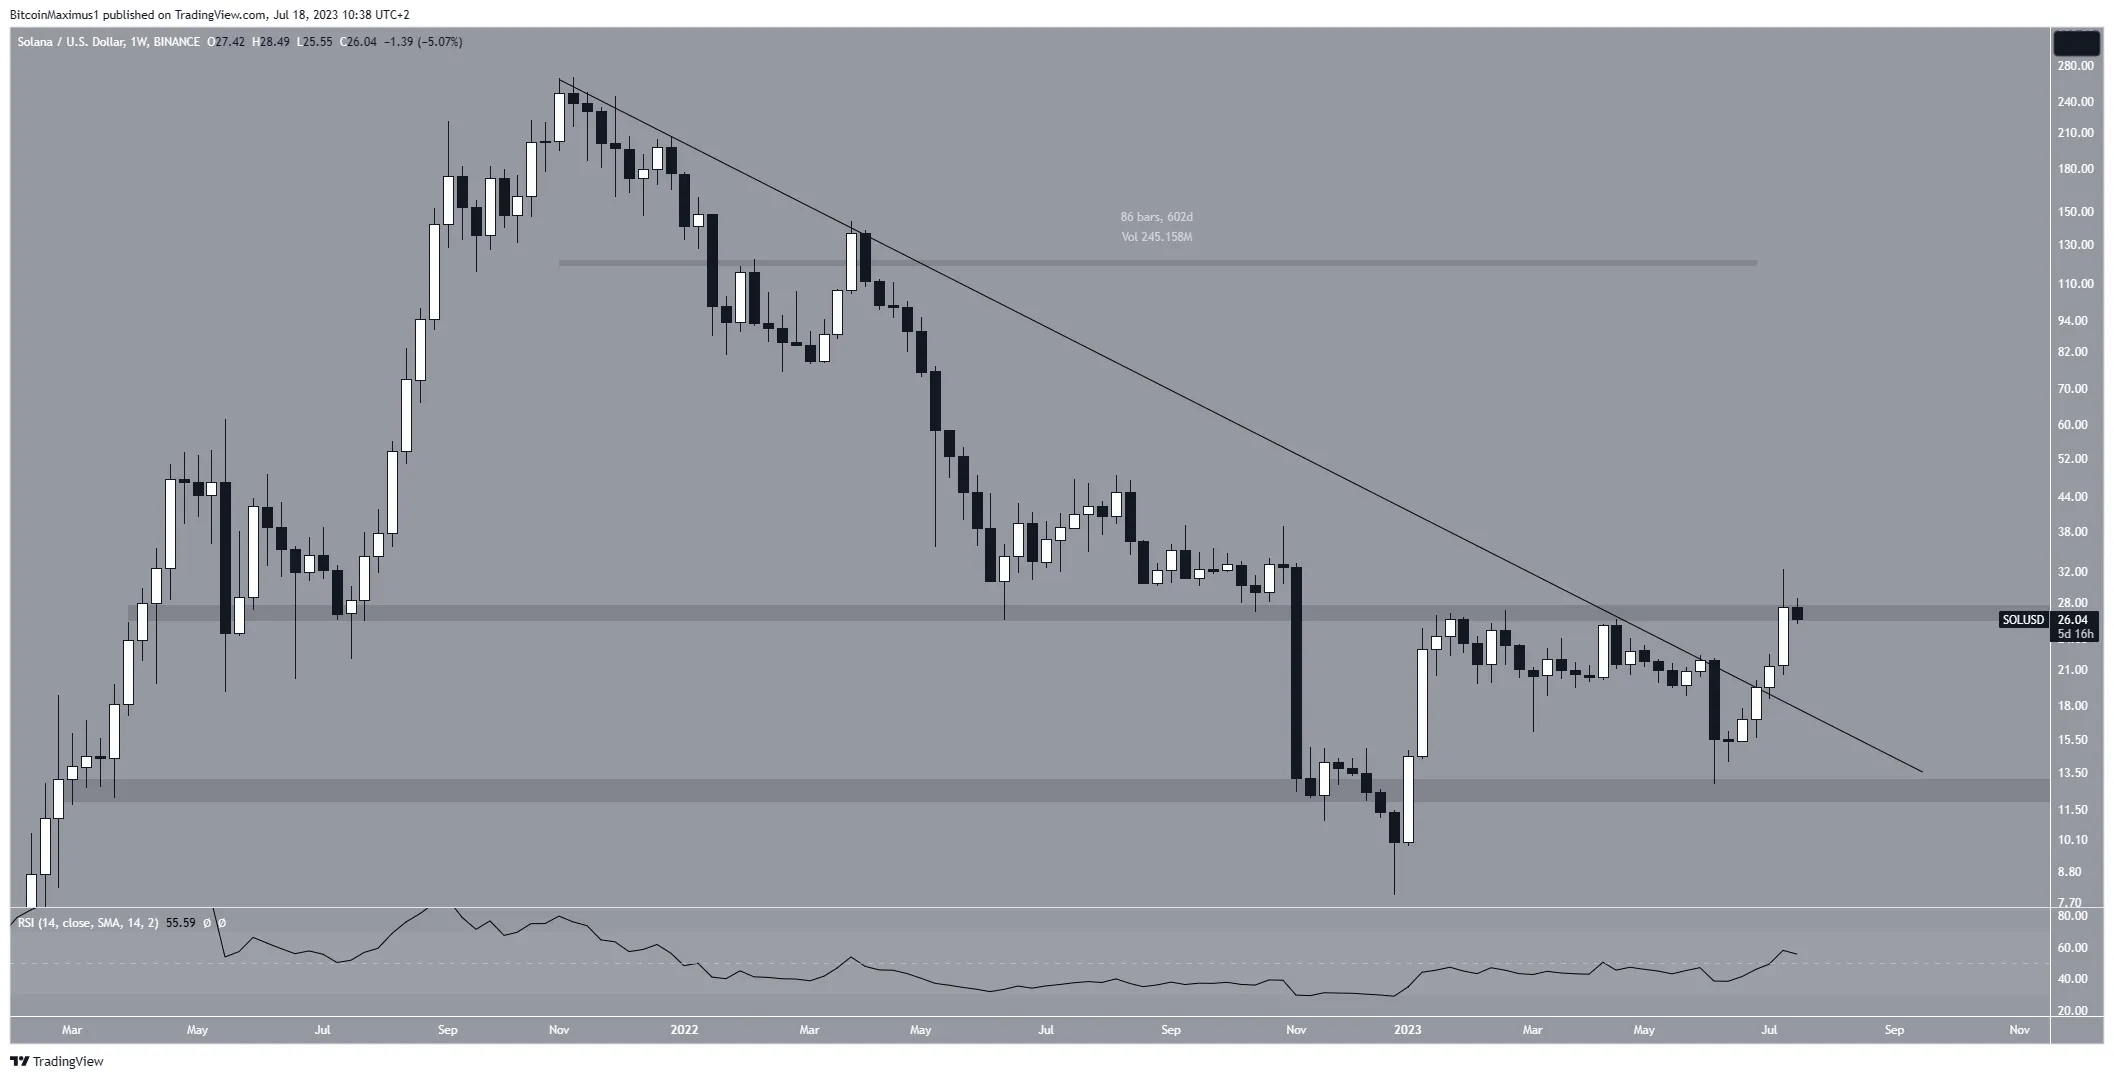
The breakout is backed by the weekly Relative Strength Index (RSI). Traders frequently use the RSI as a momentum indicator to determine if a market is overbought or oversold, helping them decide whether to buy or sell an asset.
The RSI has displayed a higher low and is currently above 50. Last week’s close above 50 was the first one since the end of 2021.
SOL Price Prediction: Is the Bullish Reversal Confirmed?
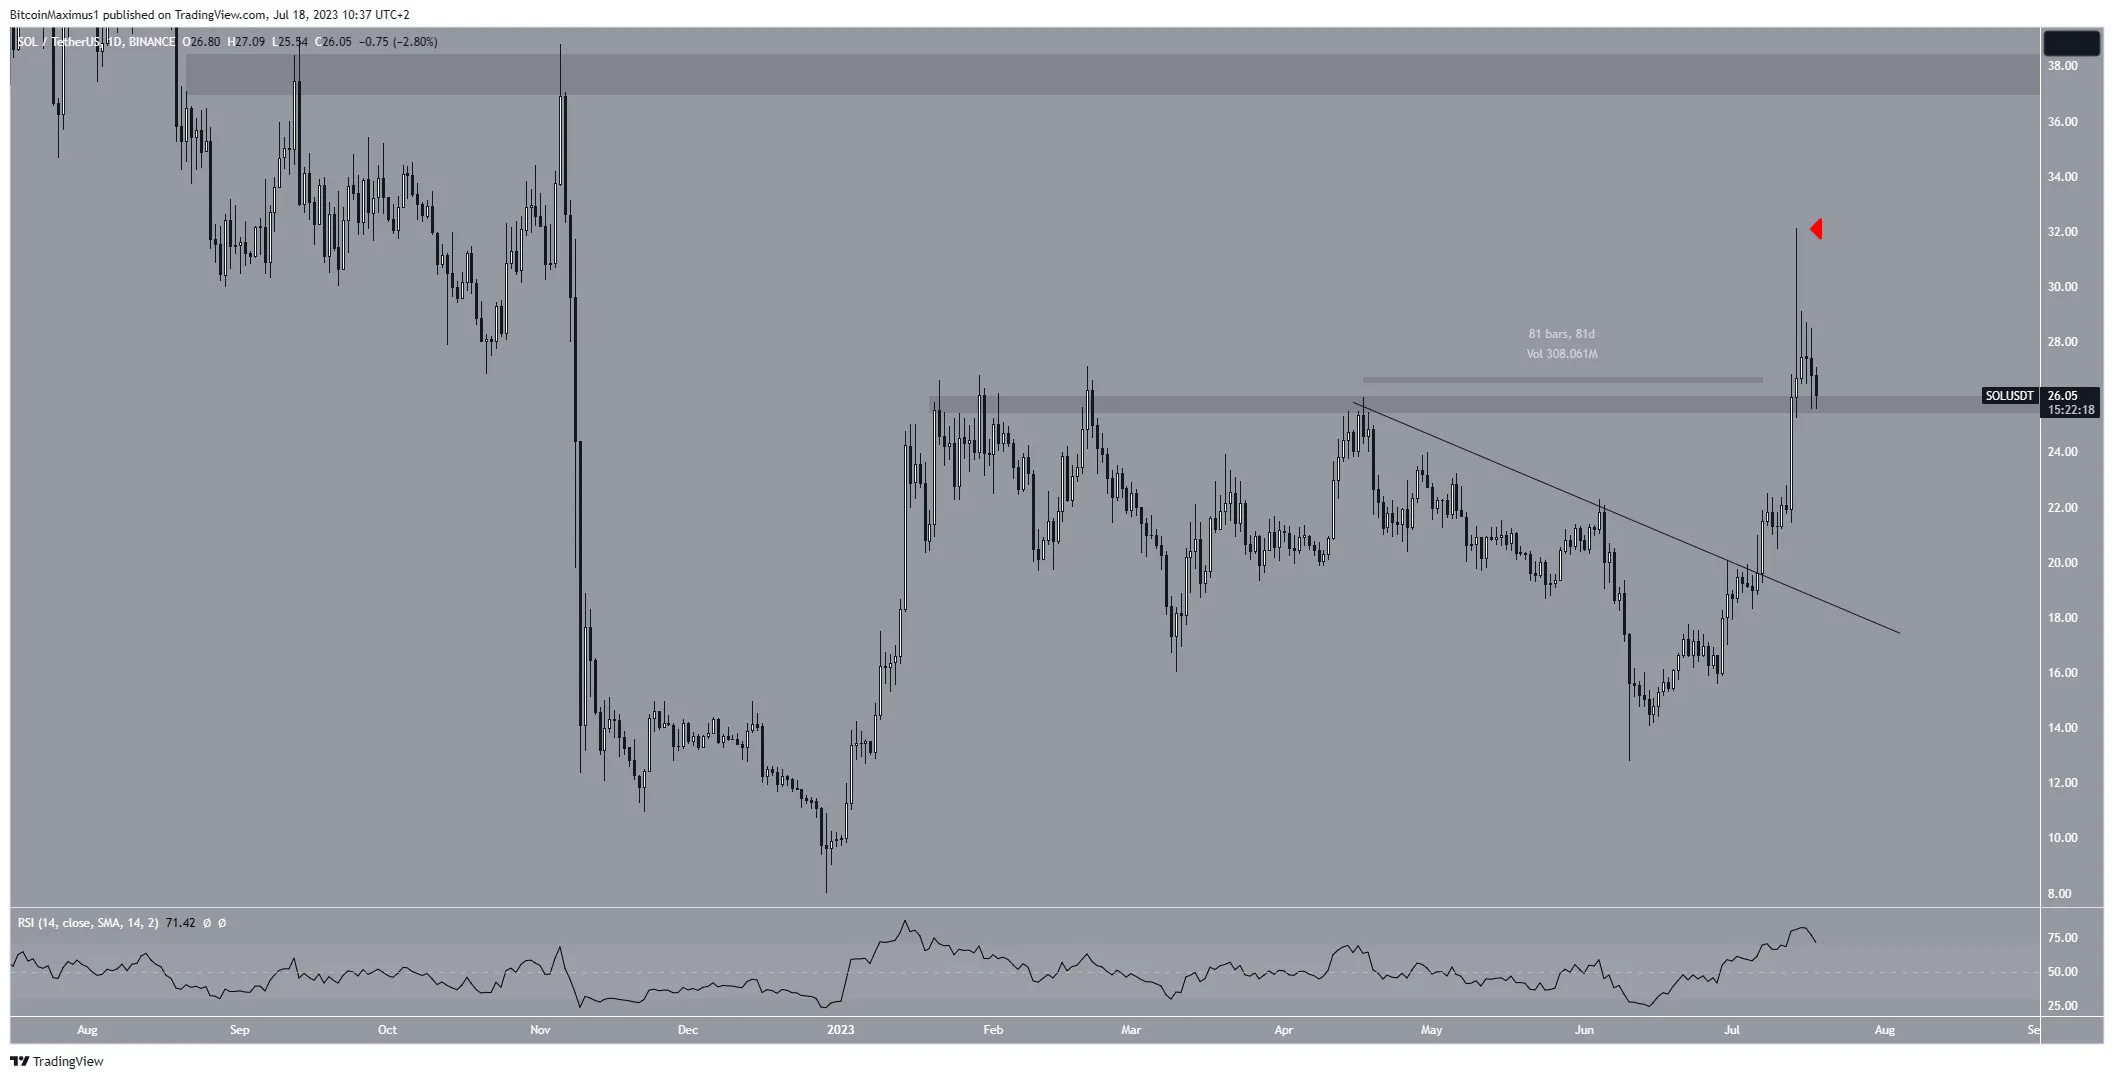
The daily time frame technical analysis shows that the SOL price has increased rapidly since June 10. During the increase, the price broke out from a descending resistance line that had been in place for 81 days. This is a sign that the upward movement is the beginning of a new trend reversal.
This possibility was further strengthened once the Solana price reclaimed the $26 horizontal area, which is now expected to provide support.
On July 14, SOL reached a new yearly high of $32.13. Even though it created a long upper wick and fell afterward, it still trades above the $26 area.
Next, the daily RSI gives a bullish reading. The indicator is increasing and is above 50, a sign of a bullish trend. Even though it is now in overbought territory, there is no bearish divergence to forewarn of a potential drop.
So, it is possible that the increase will continue toward the next resistance area at $38.
Despite this bullish Solana price prediction, a close below $26 will invalidate the breakout and can cause a drop to $20.
However, besides the long upper wick, no signs indicate this is the case.
For BeInCrypto’s latest crypto market analysis, click here
Disclaimer
In line with the Trust Project guidelines, this price analysis article is for informational purposes only and should not be considered financial or investment advice. BeInCrypto is committed to accurate, unbiased reporting, but market conditions are subject to change without notice. Always conduct your own research and consult with a professional before making any financial decisions.
[ad_2]
Source link