


[ad_1]
The Polygon (MATIC) price has failed to clear a long-term horizontal resistance and is trading inside a short-term bearish pattern.
A breakdown from the pattern will confirm that the trend is bearish, and new lows will follow soon.
Polygon Price Faces Rejection from Horizontal Resistance
The analysis of MATIC’s weekly time frame provides a negative outlook. The main reason for this is the rejection from the horizontal $0.80 resistance area. The area had provided support since July 2022 and has turned to resistance over the past two weeks.
The price created a long upper wick (red icon) during the rejection. This is a sign of selling pressure since it means that buyers could not push the price up. Rather, sellers took over and took MATIC below the resistance area.

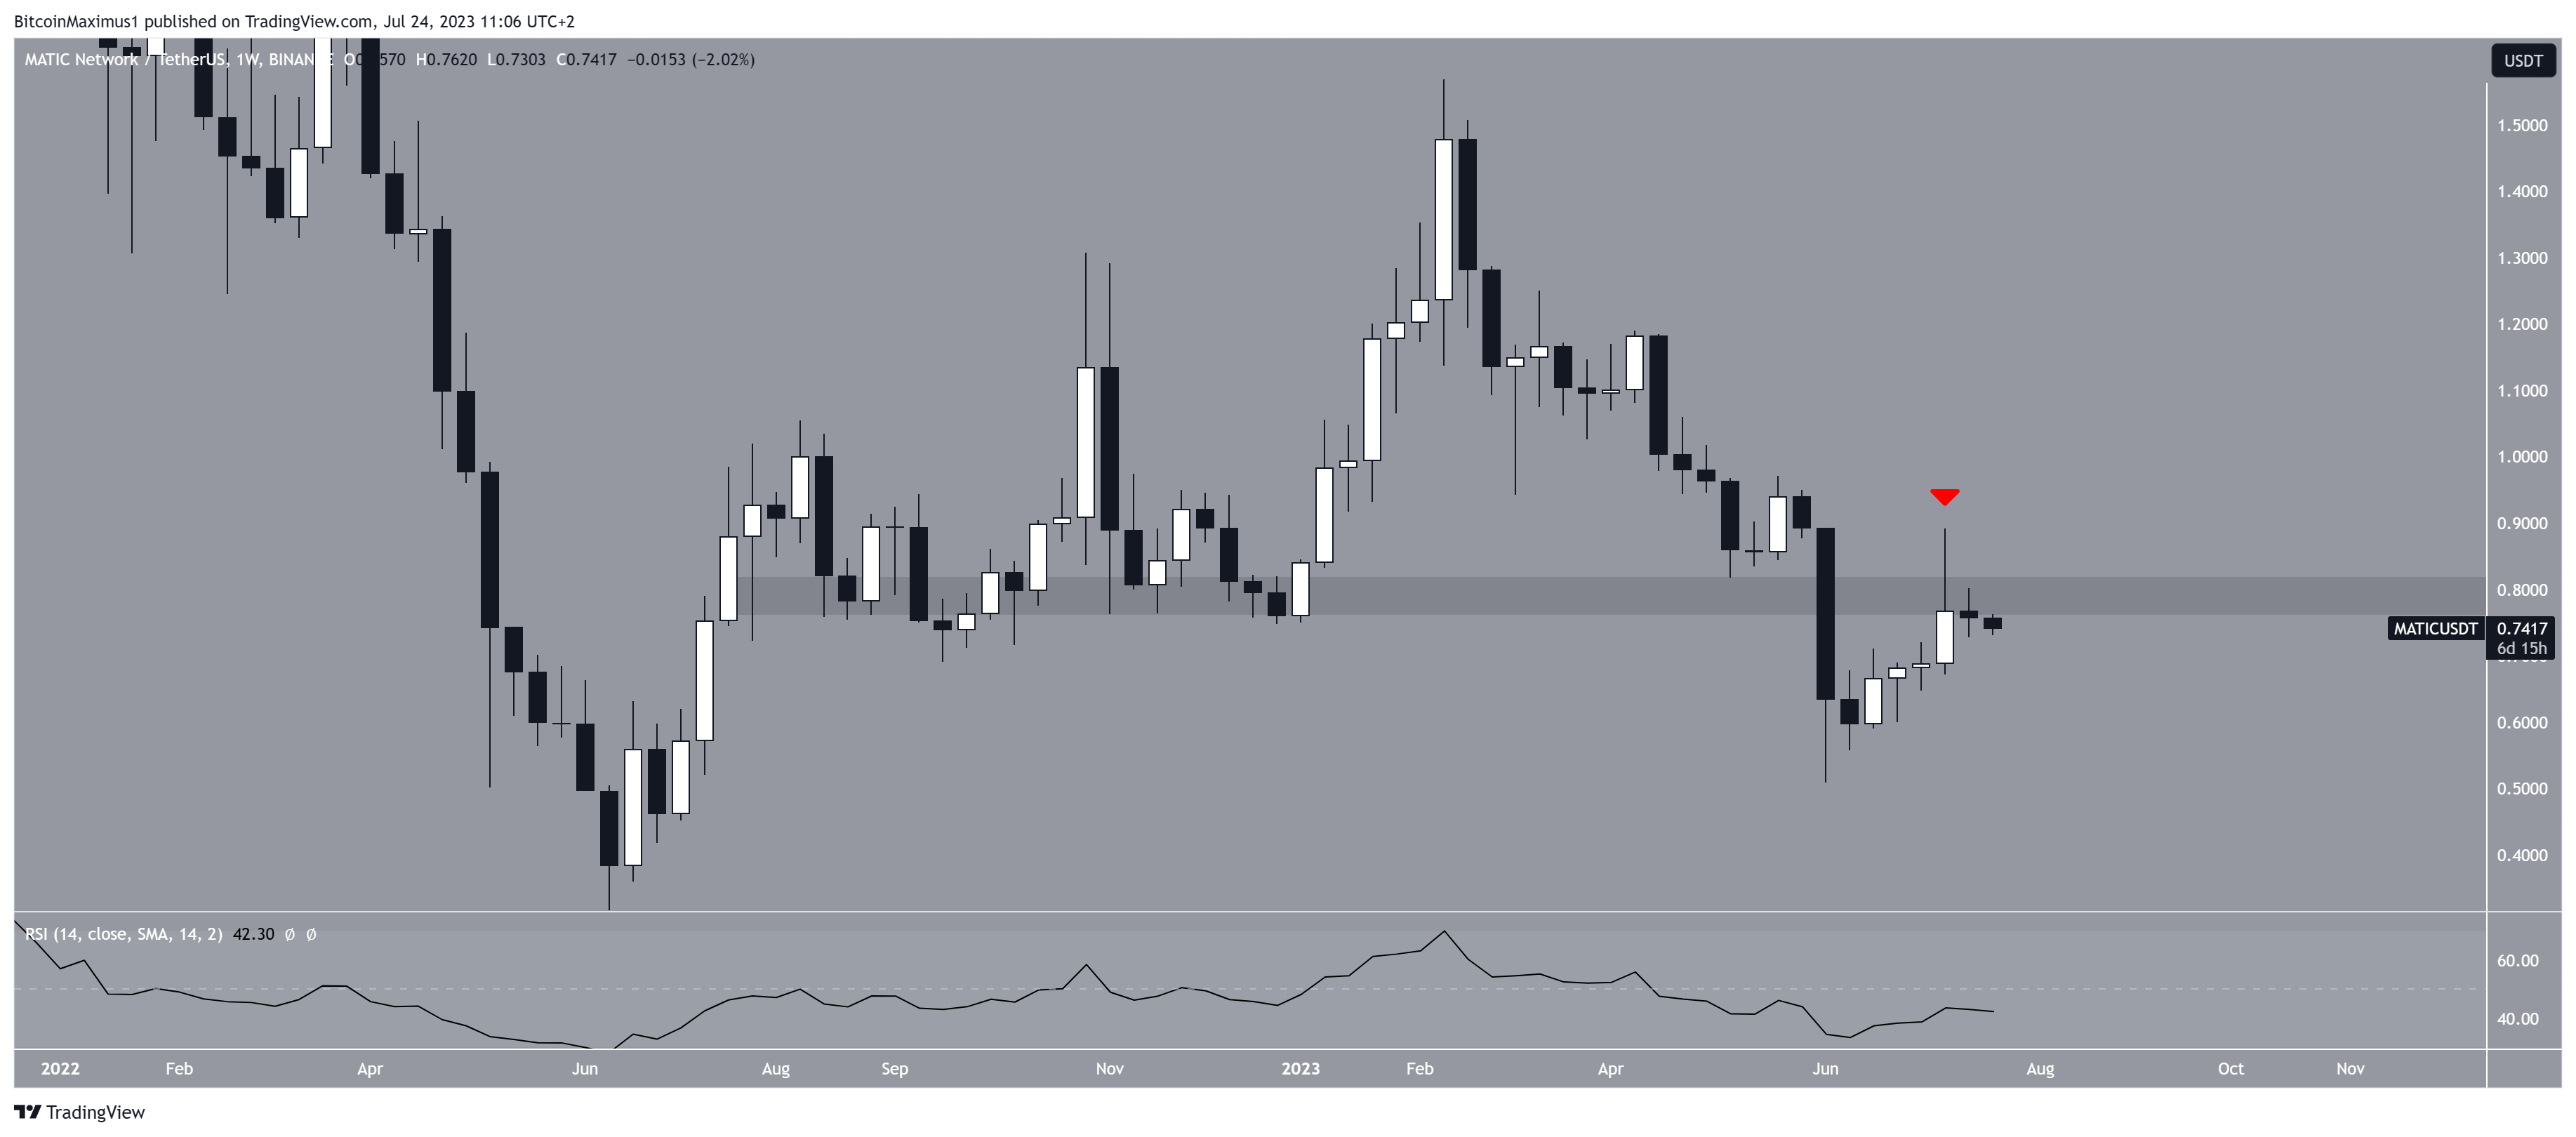
Furthermore, the weekly Relative Strength Index (RSI) gives a bearish sentiment. The RSI is a momentum indicator that helps traders determine if a market is overbought or oversold, enabling them to decide on accumulating or selling an asset.
Bulls have the advantage when the RSI reading is above 50, and the trend is upward. Conversely, if the reading is below 50, the opposite holds true. The RSI is below 50, a sign of a bearish trend.
MATIC Price Prediction: Breakdown Can Accelerate Decrease
Similarly to the weekly chart, the daily one provides a bearish reading. The main reason for this is the presence of an ascending parallel channel, which is considered a bearish pattern. Therefore, a breakdown from the channel is the most likely future price scenario.
Furthermore, MATIC is trading in the lower portion of the channel, further increasing the possibility that a breakdown will transpire.
However, the daily RSI does not confirm the bearish trend yet. While the indicator is falling, it is still at the 50 line, allowing for the possibility of a bounce.
If a breakdown occurs, the next closest support will be at $0.60.
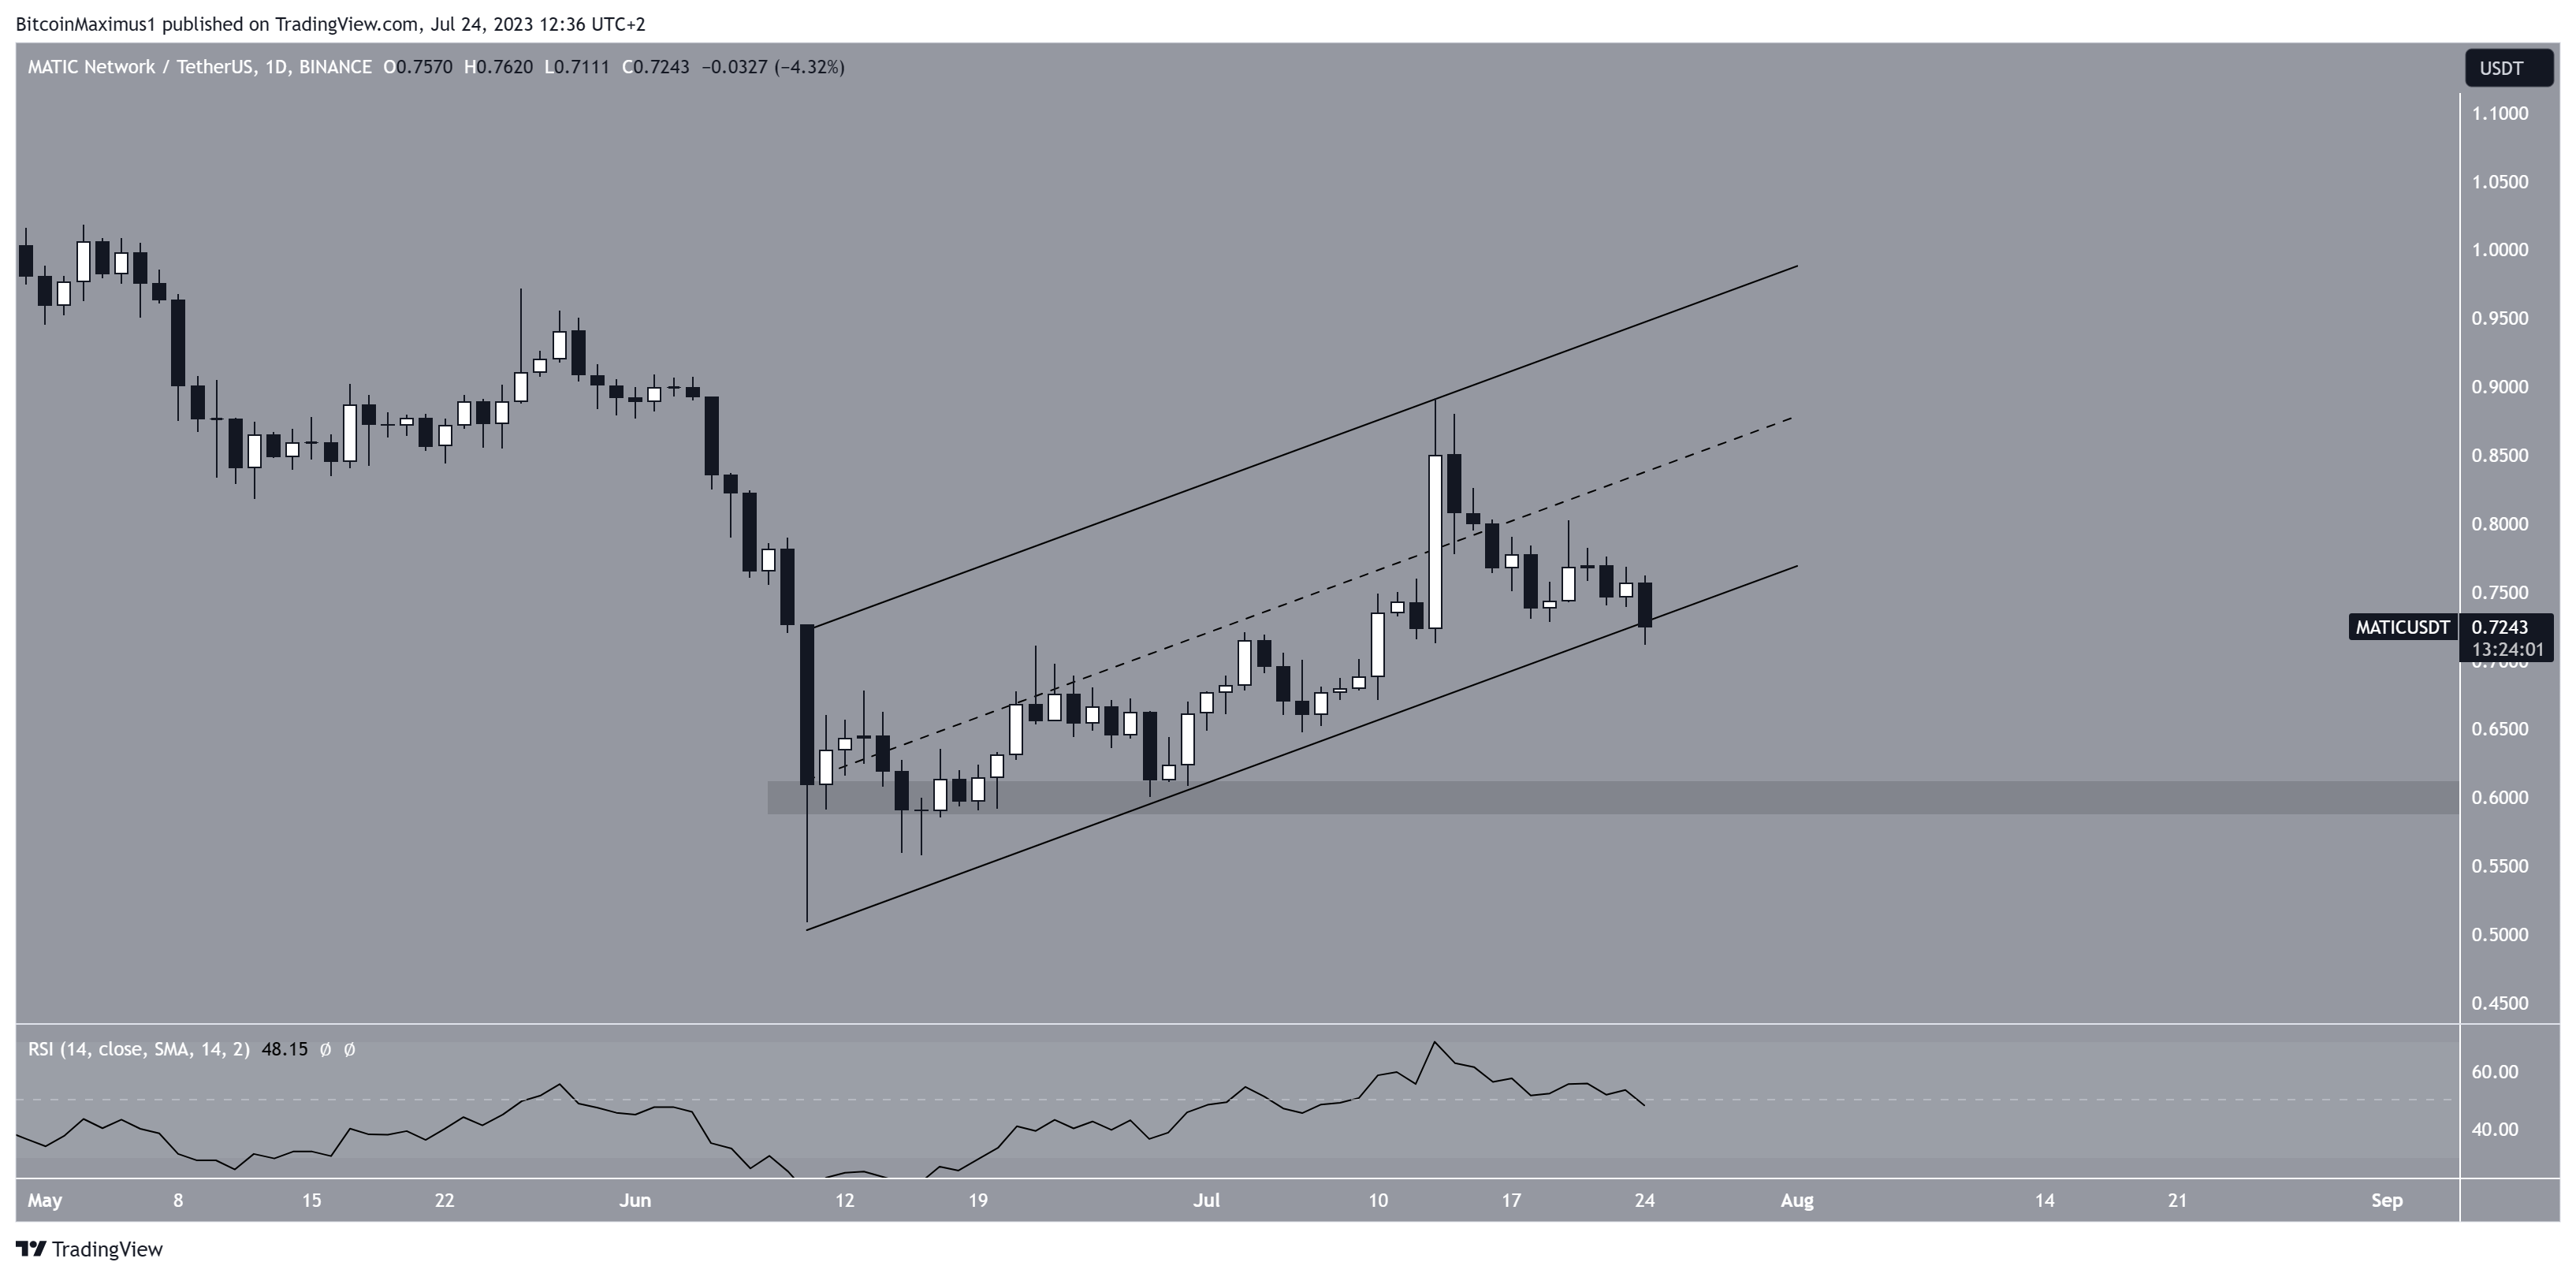
Despite this bearish MATIC price prediction, a strong bounce at the channel’s support line will indicate that the trend is bullish instead. In that case, the price can move to the channel’s resistance line at $1.
For BeInCrypto’s latest crypto market analysis, click here.
Disclaimer
In line with the Trust Project guidelines, this price analysis article is for informational purposes only and should not be considered financial or investment advice. BeInCrypto is committed to accurate, unbiased reporting, but market conditions are subject to change without notice. Always conduct your own research and consult with a professional before making any financial decisions.
[ad_2]
Source link