
 Price Steady at $0.50 Amid Massive Escrow Release")

[ad_1]
Ripple’s XRP price broke out from a 700-day resistance line and culminated with a yearly high of $0.94. However, the price has fallen since, validating the $0.90 resistance area.
While the long-term trend is bullish due to the breakout above, the short-term one is still undecided. Thus, another final decrease could occur before the price regains its footing.
XRP Price Faces Rejection Despite Long-Term Breakout
The weekly time frame analysis for XRP indicates a positive outlook. This is primarily due to the breakout from a 700-day descending resistance line. Breakouts from such long-term structures often result in significant movements in the opposite direction.
After the breakout, XRP surpassed the $0.54 horizontal area, forming a bullish candlestick (green icon). Subsequently, the price reached the next resistance level at $0.90 but faced rejection within the same week (red icon). Presently, XRP is trading between these two levels.

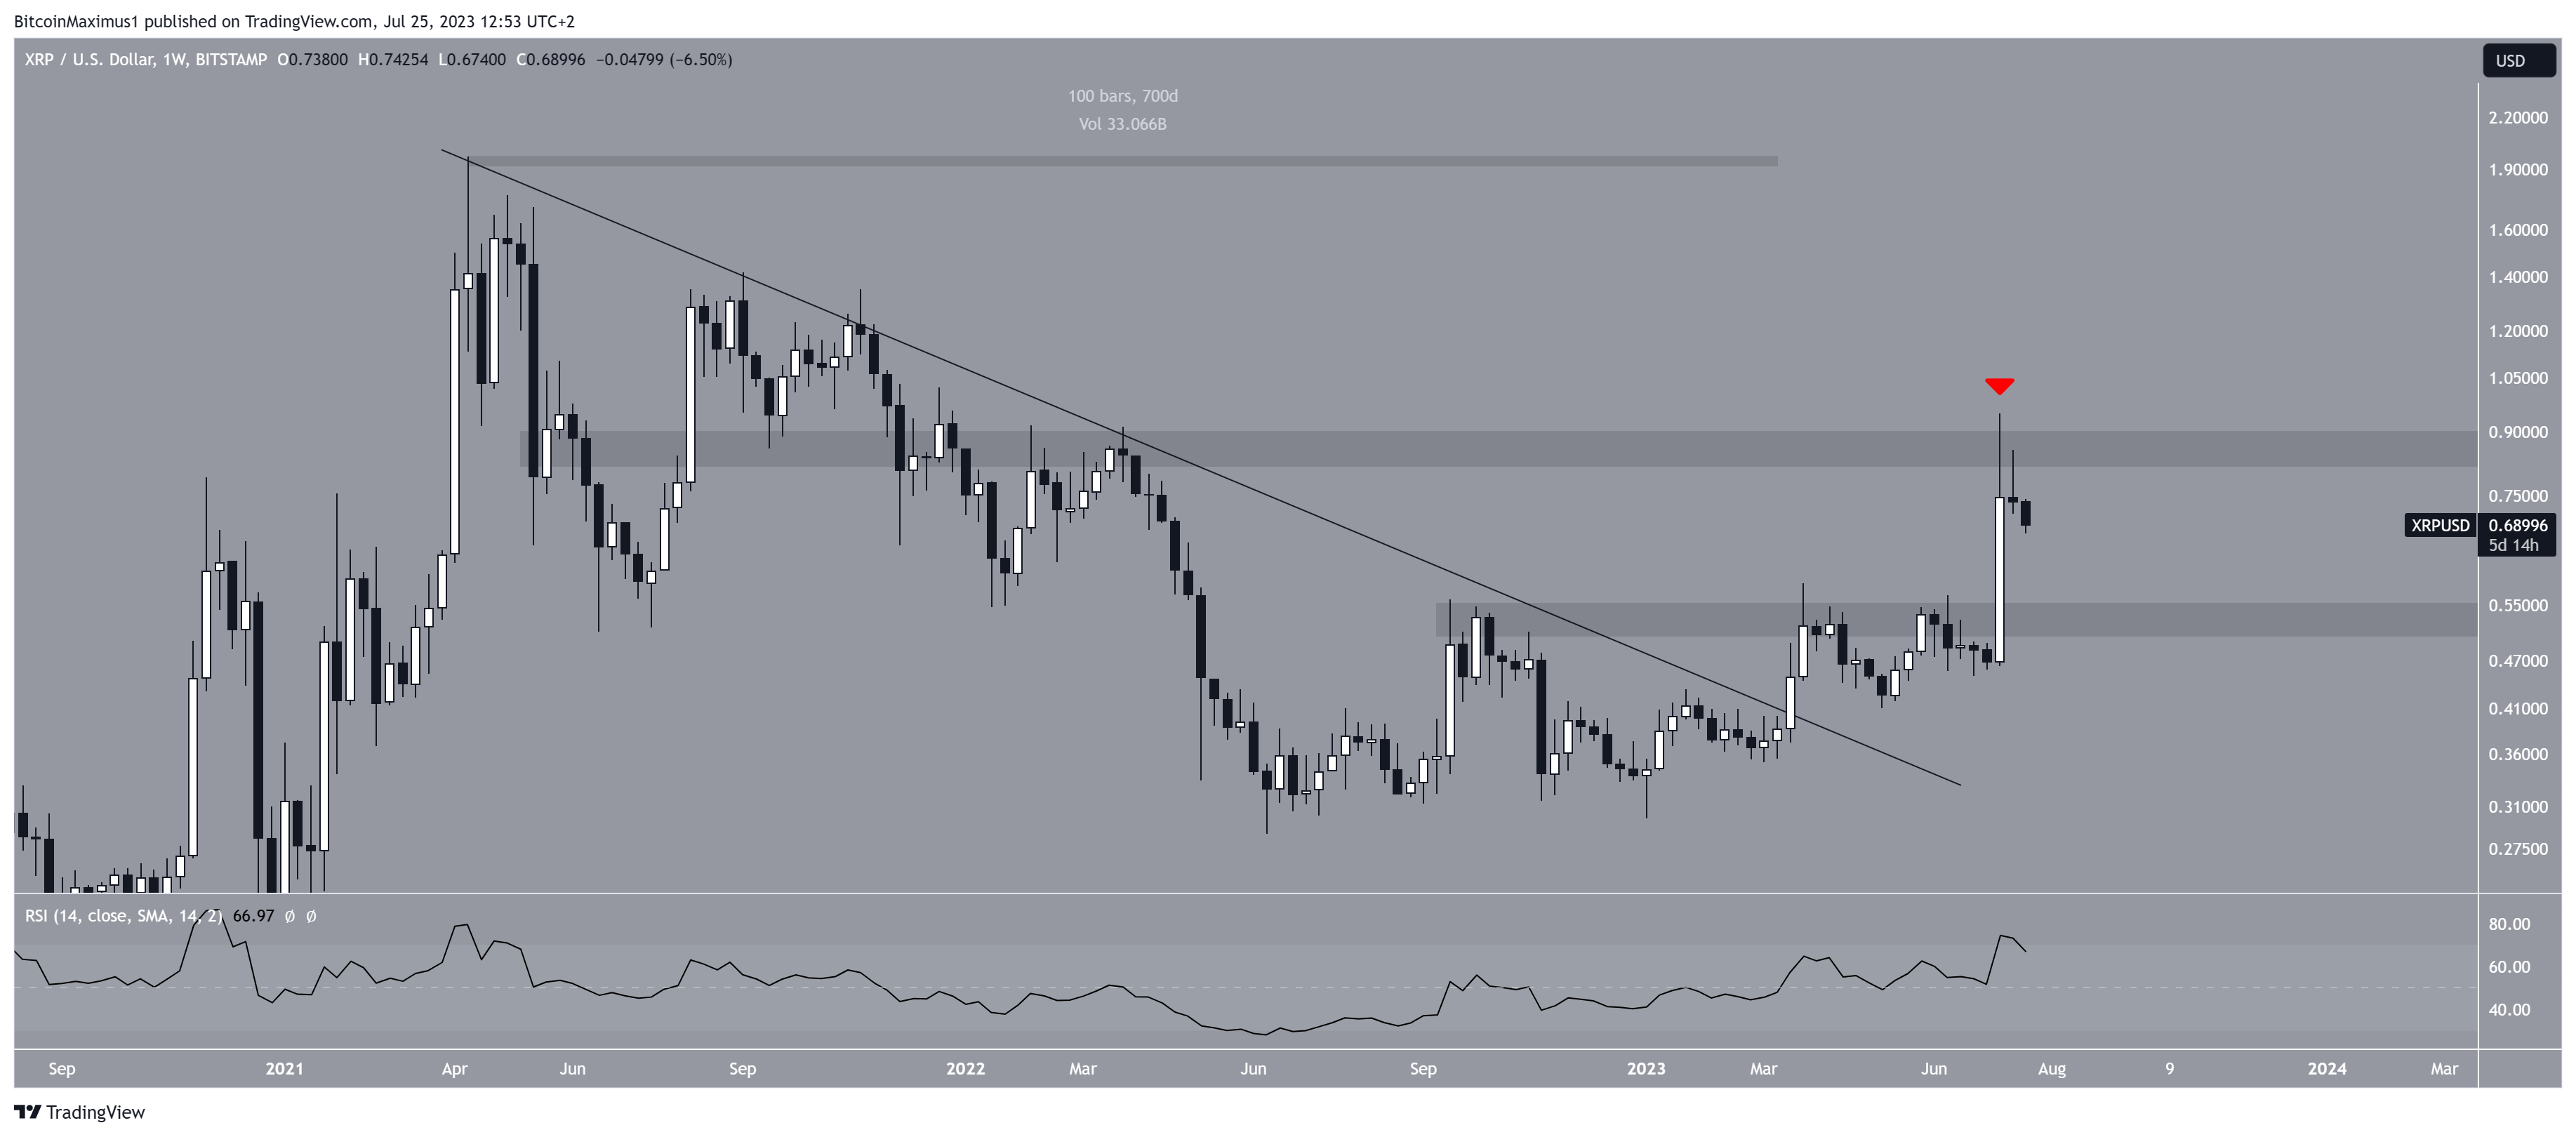
The weekly Relative Strength Index (RSI) further supports the likelihood of a continued increase. Traders use the RSI as a momentum indicator to assess whether a market is overbought or oversold and to make decisions about accumulating or selling an asset.
Since the RSI reading is above 50 and rising, it indicates a bullish trend, signifying that bulls still hold an advantage in the market.
XRP Price Prediction: Where Does Wave Count Predict Price Bottom?
The technical analysis from the short-term six-hour time frame also provides a bullish outlook. The main reason for this is the wave count.
Technical analysts employ the Elliott Wave theory as a means to identify recurring long-term price patterns and investor psychology, which helps them determine the direction of a trend.
The most likely wave count suggests that the XRP price is currently in wave four of a five-wave increase (white). This means that the rate of increase is expected to accelerate toward $1 after the correction is done.
The most likely area for the bottom of wave four is at $0.64. The area is created by a confluence of support levels, namely the 0.618 Fib retracement support level and the previous ascending parallel channel. A strong bounce at this level will confirm that wave five has begun.
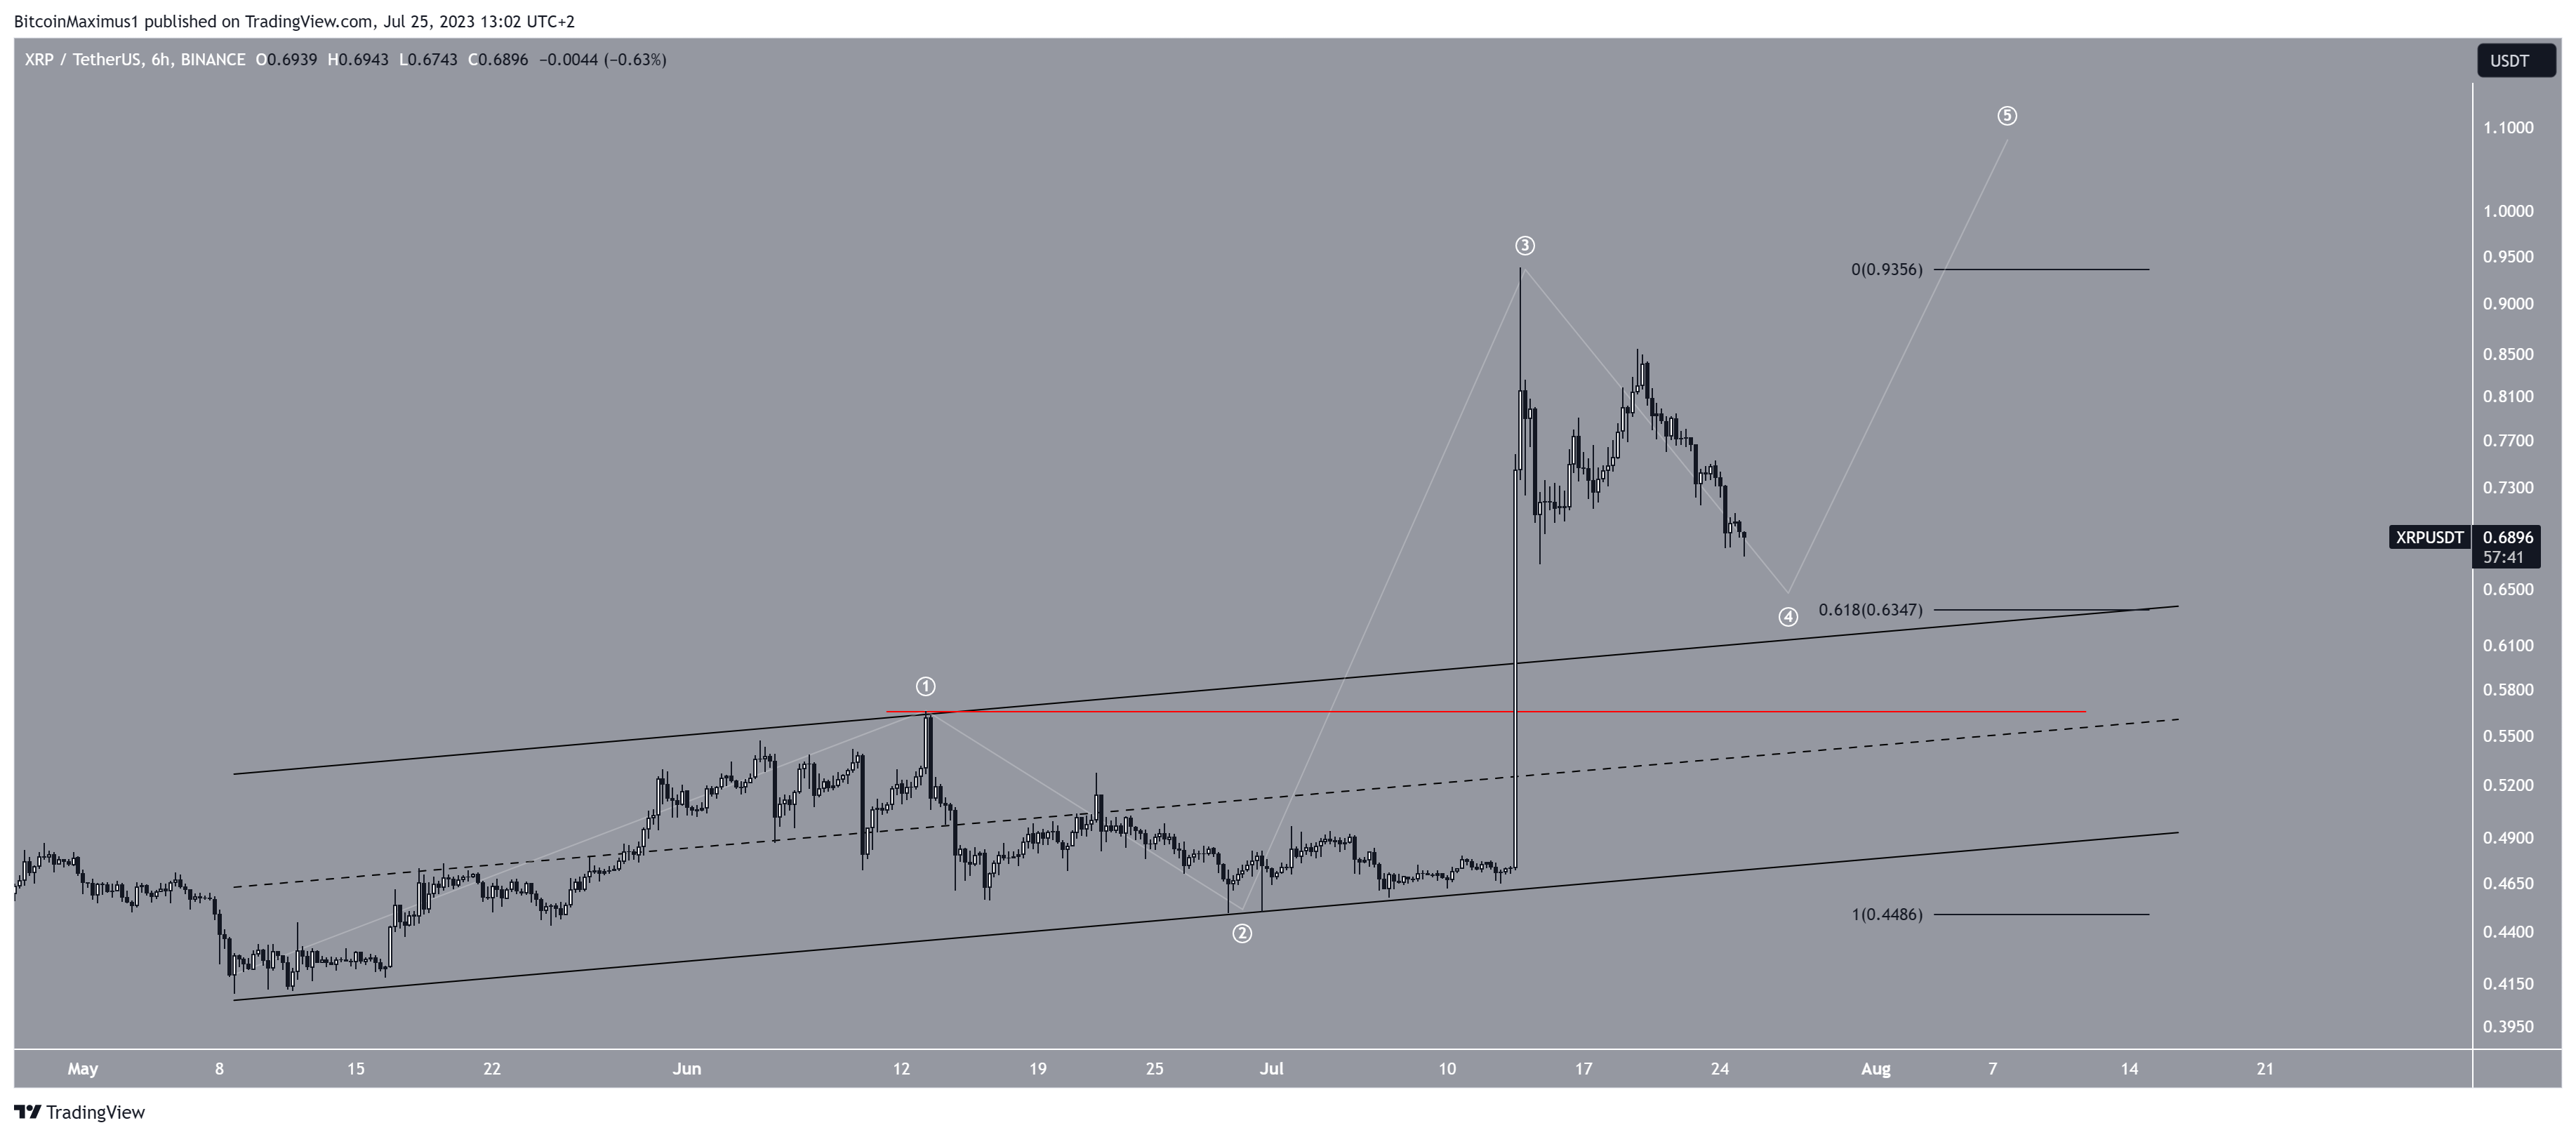
Despite this bullish XRP price prediction, a decrease below the wave one high at $0.56 (red line) will mean that the trend is bearish. In that case, the XRP price will be expected to decrease to $0.40.
For BeInCrypto’s latest crypto market analysis, click here.
Disclaimer
In line with the Trust Project guidelines, this price analysis article is for informational purposes only and should not be considered financial or investment advice. BeInCrypto is committed to accurate, unbiased reporting, but market conditions are subject to change without notice. Always conduct your own research and consult with a professional before making any financial decisions.
[ad_2]
Source link