[ad_1]
The Litecoin (LTC) price broke out from a short-term bullish pattern but failed to maintain its increase. The price now trades close to its pre-breakout levels.
In any case, the trend can still be considered bullish as long as the price does not close below its pre-breakout levels.
Litecoin Price Deviates and Falls Below Resistance
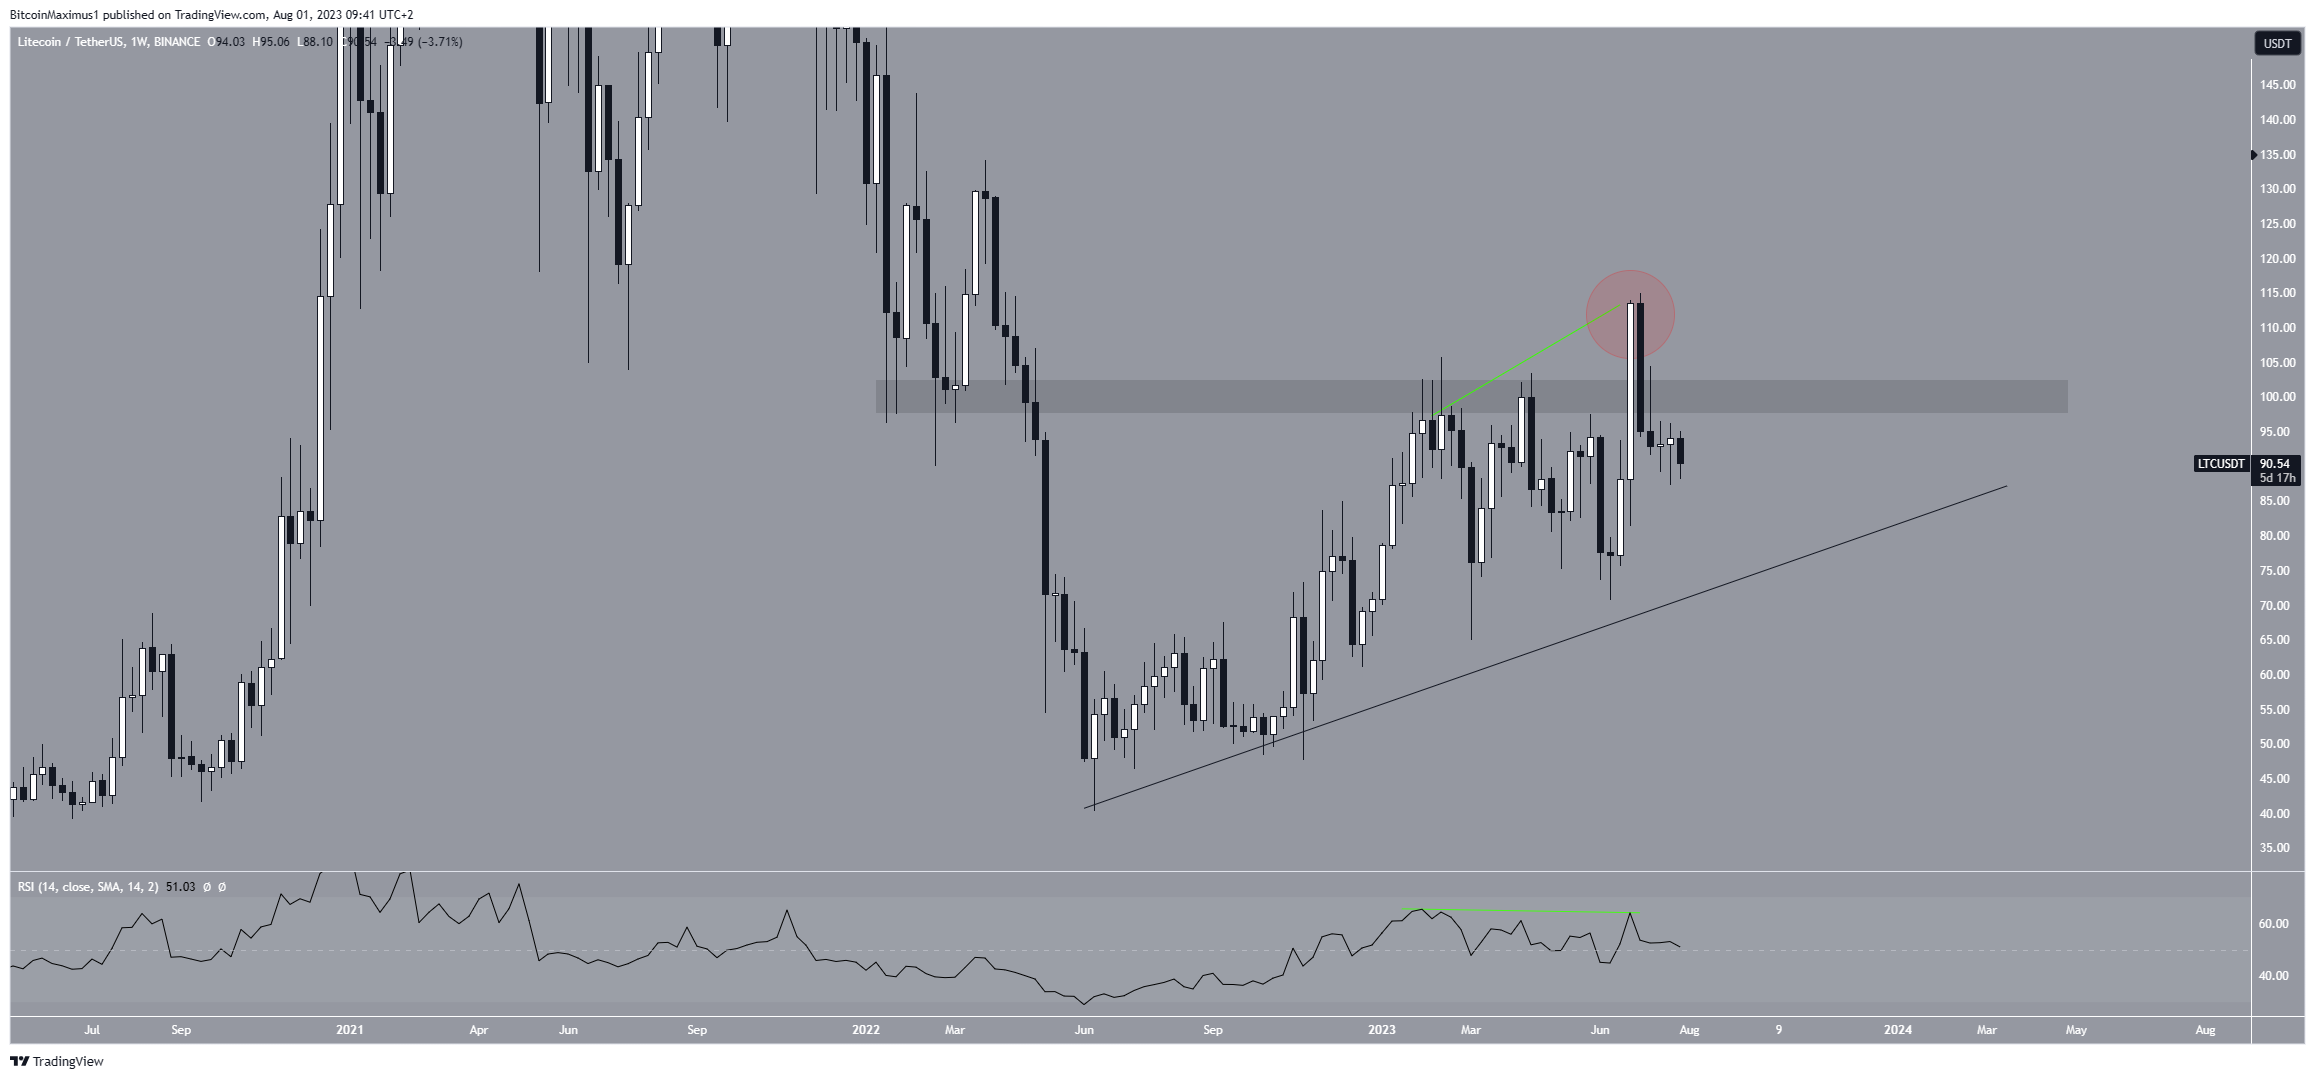
The technical analysis of the weekly time frame provides a bearish outlook due to bearish readings from the price action and RSI.
The price action is bearish, since it shows that LTC deviated (red circle) above the $100 horizontal area and then validated it as resistance again. The deviation is considered a bearish sign and most often leads to significant downward movements. This was the case in LTC which now trades at $90.
The long-term ascending support line in place for more than a year is currently at $72.

Additionally, the weekly RSI is bearish, supporting the continuation of the decrease. Traders utilize the RSI as a momentum indicator to assess whether a market is overbought or oversold and to determine whether to accumulate or sell an asset.
If the RSI reading is above 50 and the trend is upward, bulls still have an advantage, but if the reading is below 50, the opposite is true. Even though the indicator is still above 50, it generated bearish divergence (green line) during the deviation. This is a bearish development where a price increase is combined with a momentum decrease. This supports the possibility that the trend is bearish.
LTC Price Prediction: Why Did Price Fail to Materialize Breakout?
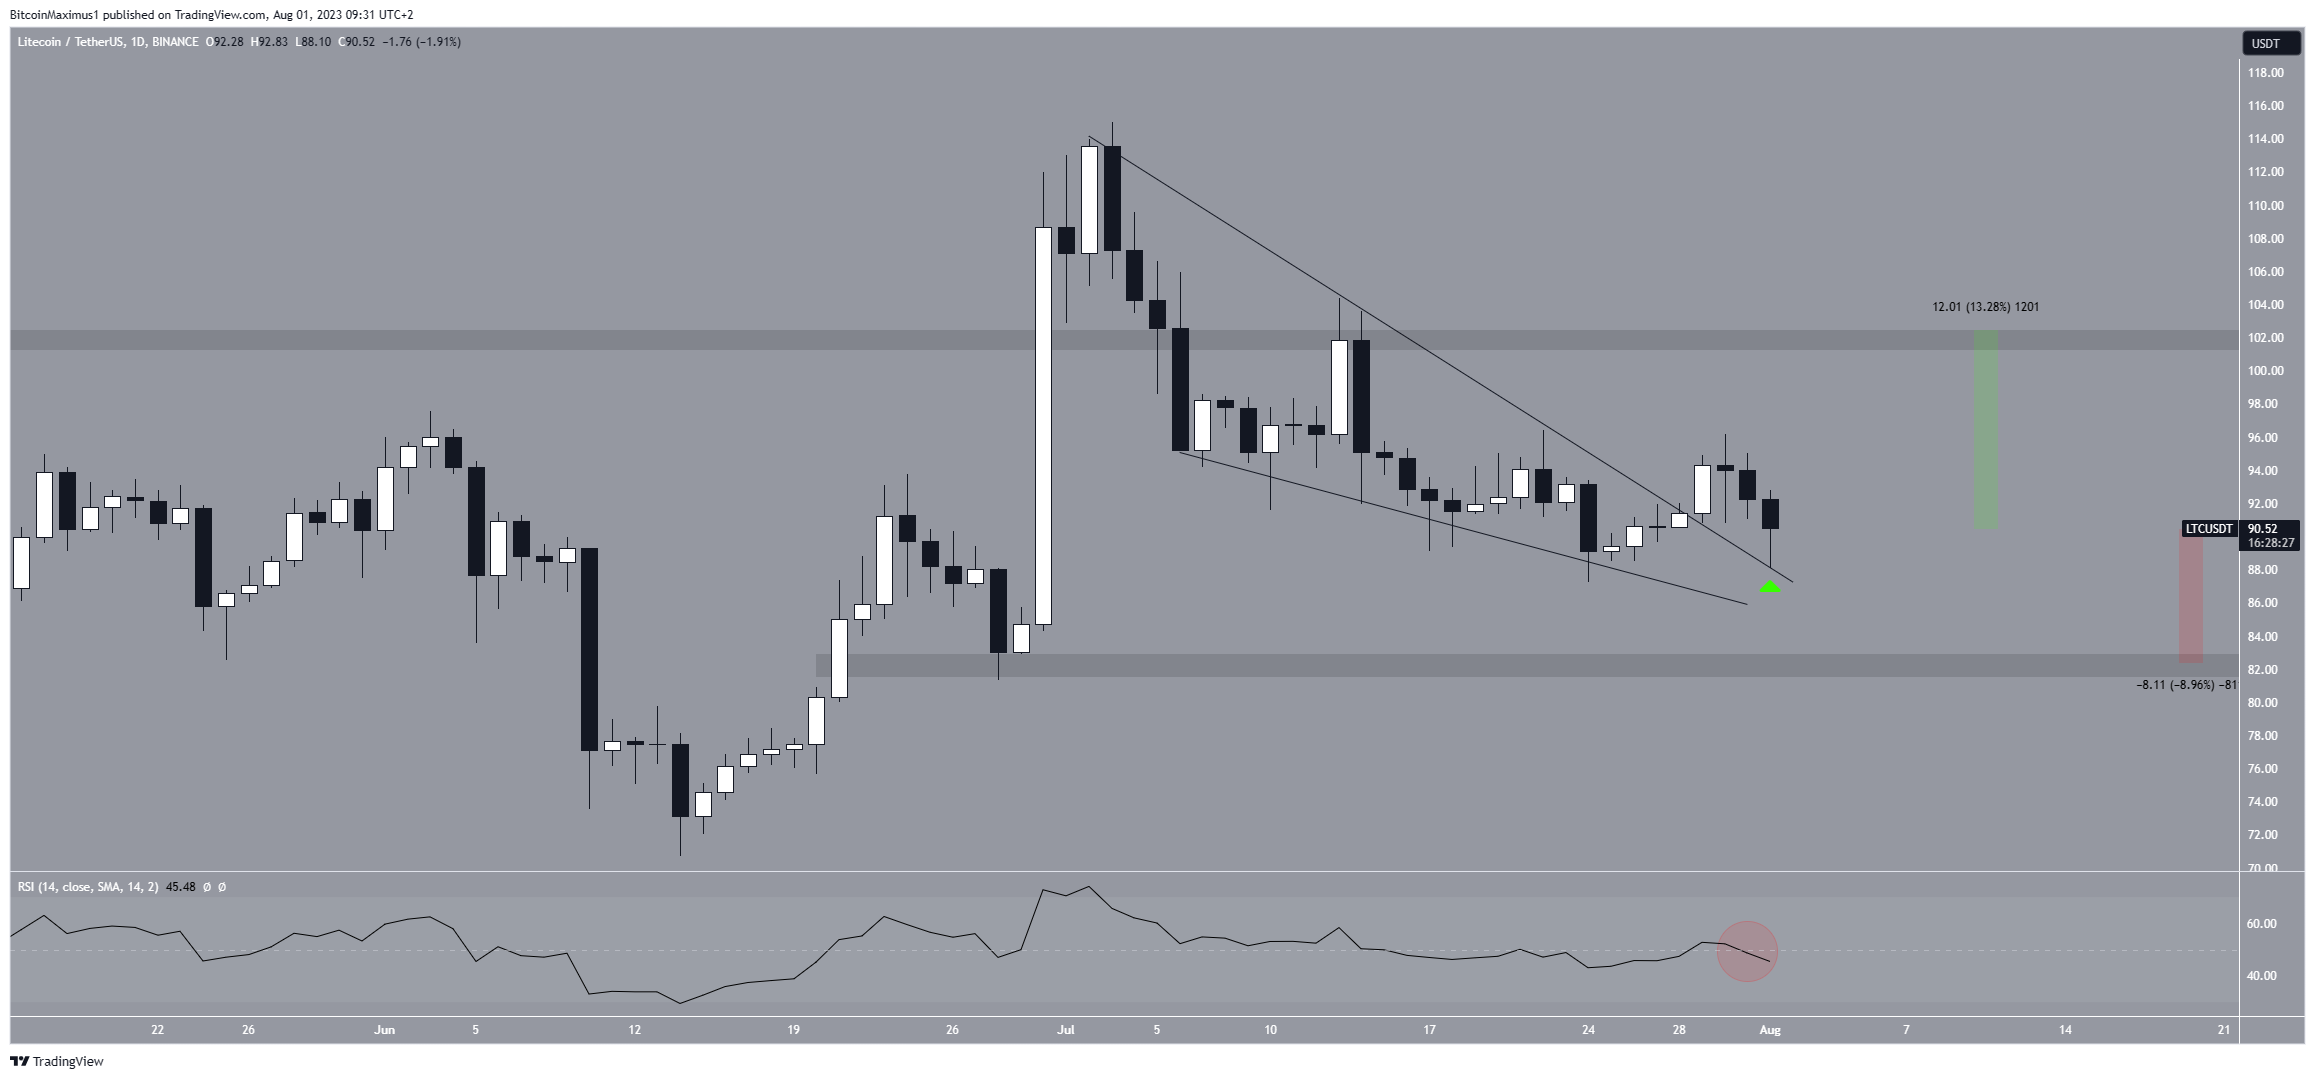
A closer look at the movement shows that the Litecoin price broke out from a descending wedge on July 28. The wedge is considered a bullish pattern, and the breakout from it was expected to lead to a significant upward movement.
The LTC price decreased shortly after the breakout, validating the wedges resistance line at $88. Since this created a long lower wick (green icon), it is possible that it is a retest of the previous resistance.
However, the RSI does not support this possibility. The indicator has fallen below 50 (red circle) and is moving downwards. This is a sign of a bearish trend and is not associated with breakouts from bullish patterns.
In any case, it is worth mentioning that whales are loading up on LTC as the halving nears. But, since block rewards are reduced, the mining hashrate in Binance’s pool has fallen to 28 terahashes per second.

Due to these conflicting readings, the LTC price prediction will be determined by whether the price falls below the wedge’s resistance line at $88 or continues the bounce.
If it falls below, it could decrease by another 9% to the $82 horizontal support area. However, if the bounce continues, the LTC price can move upwards by 13% and reach the $102 resistance area.
For BeInCrypto’s latest crypto market analysis, click here
Disclaimer
In line with the Trust Project guidelines, this price analysis article is for informational purposes only and should not be considered financial or investment advice. BeInCrypto is committed to accurate, unbiased reporting, but market conditions are subject to change without notice. Always conduct your own research and consult with a professional before making any financial decisions.
[ad_2]
Source link


