[ad_1]
The DOGE price has broken out from a crucial long-term resistance area. But, the movement did not lead to a sharp increase as expected and the price now trades close to its pre-breakout levels.
Nevertheless, the long-term outlook remains bullish in both the DOGE/USDT and DOGE/BTC pairs.
Dogecoin Price Clears Long-Term Resistance
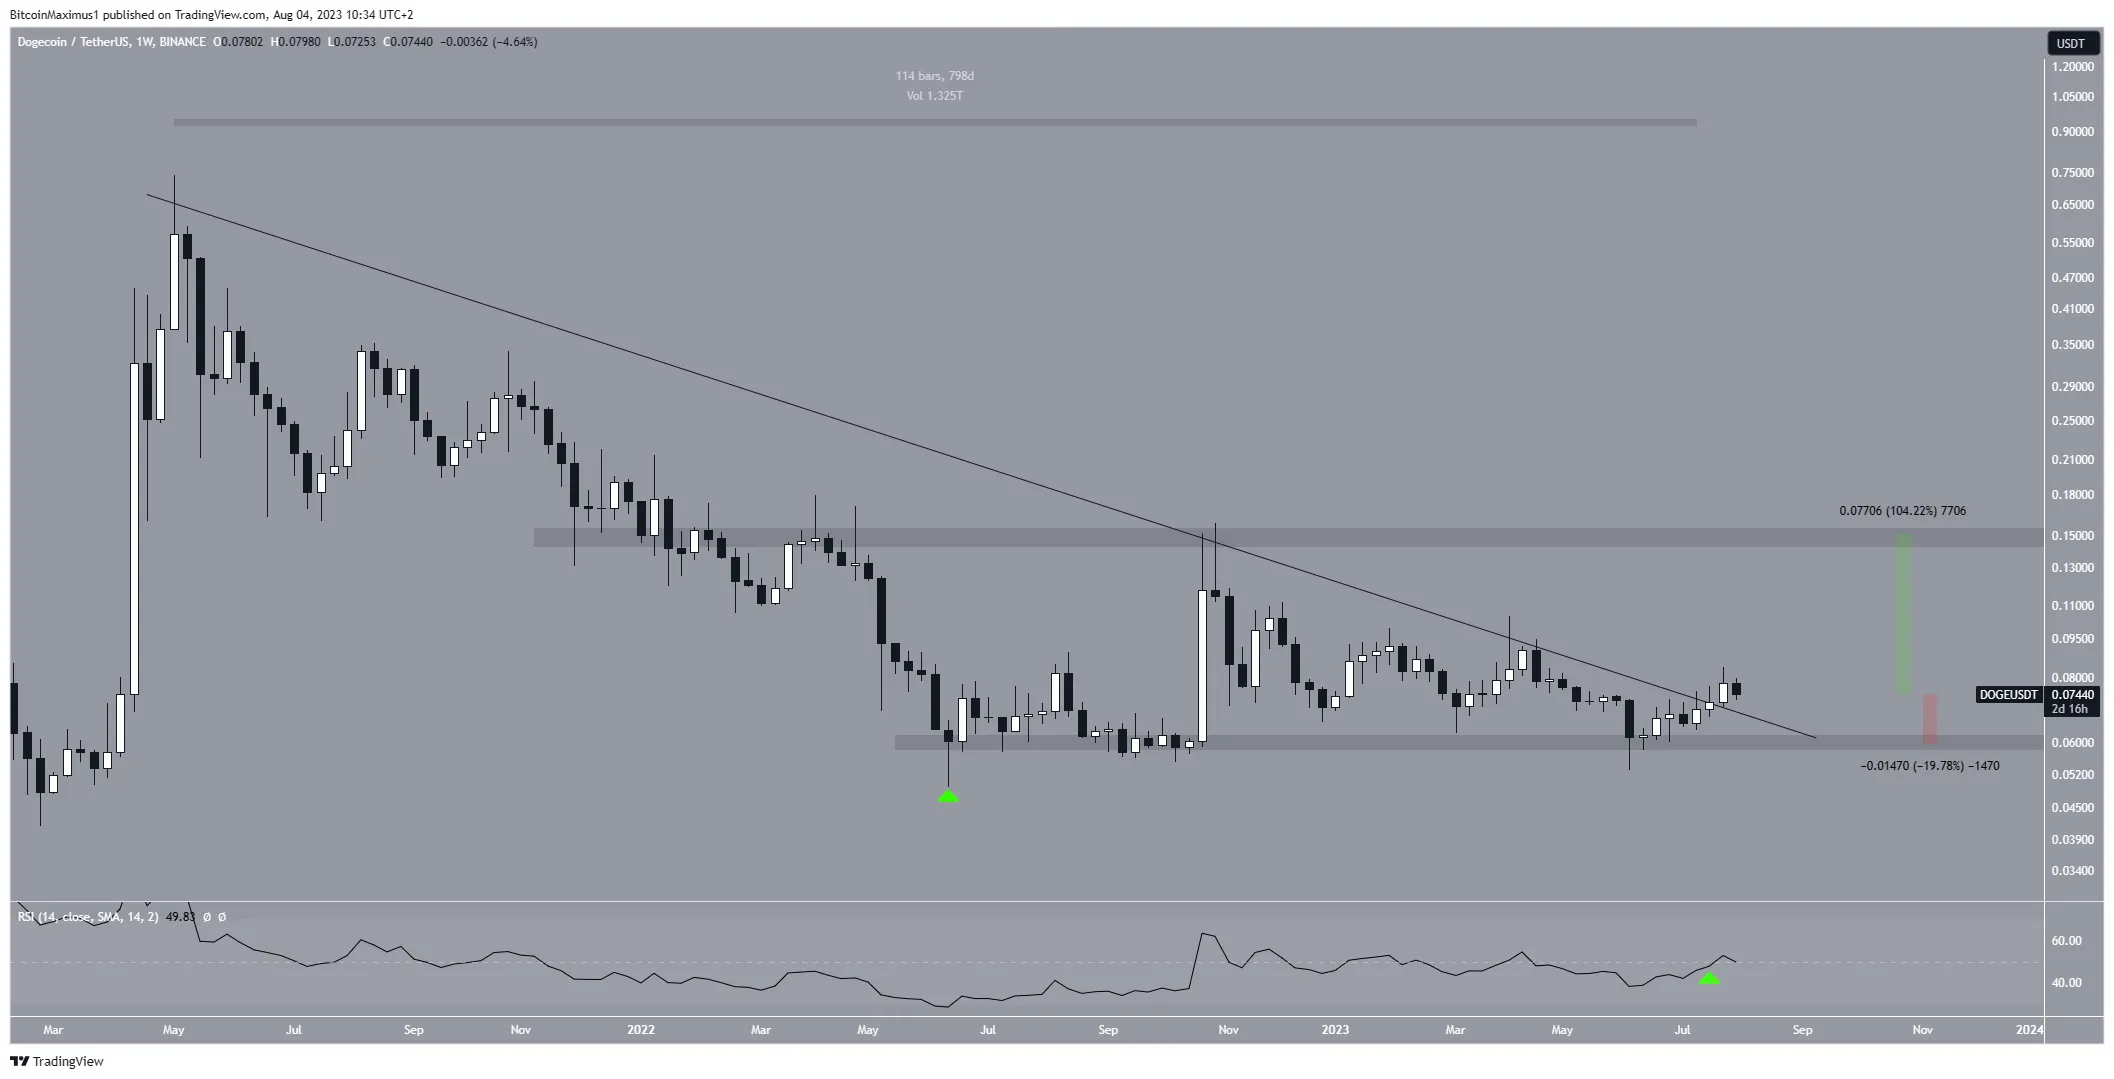
A look at the weekly time frame technical analysis for DOGE shows that the meme coin had been following a downward resistance trendline after reaching its all-time high of $0.739 in May 2021. This decline led to a low point of $0.049 (green icon) in June 2022.
Following that, DOGE entered a recovery phase. It began trading above the $0.060 horizontal support level. After several unsuccessful attempts over a period of six months, the price of DOGE finally broke above the resistance line on July 15, which had been in place for an impressive 805 days.
Some speculate that the increase might be attributed to Elon Musk’s rebranding of Twitter.
Breakouts from such long-term patterns often lead to significant price increases as they signal the end of the previous trend. However, it’s important to note that the expected price increase has not yet occurred.

The weekly Relative Strength Index (RSI) reading does not provide a definitive conclusion. RSI is a momentum indicator used by traders to assess whether a market is overbought or oversold, helping with buying or selling decisions.
When RSI readings are above 50 and moving upward, it suggests that the bulls have an advantage. Conversely, readings below 50 indicate the opposite scenario. The RSI moved slightly above 50 last week, but since it is still hovering just above the area, the trend’s direction is still unclear.
A drop to the $0.060 support area would amount to a decrease of 20%, while if the upward movement continues, DOGE could increase by 100% to $0.150.
Dogecoin Gains Against Bitcoin (BTC)
The weekly timeframe for the DOGE/BTC pair also shows a bullish outlook. There are two main reasons for this.
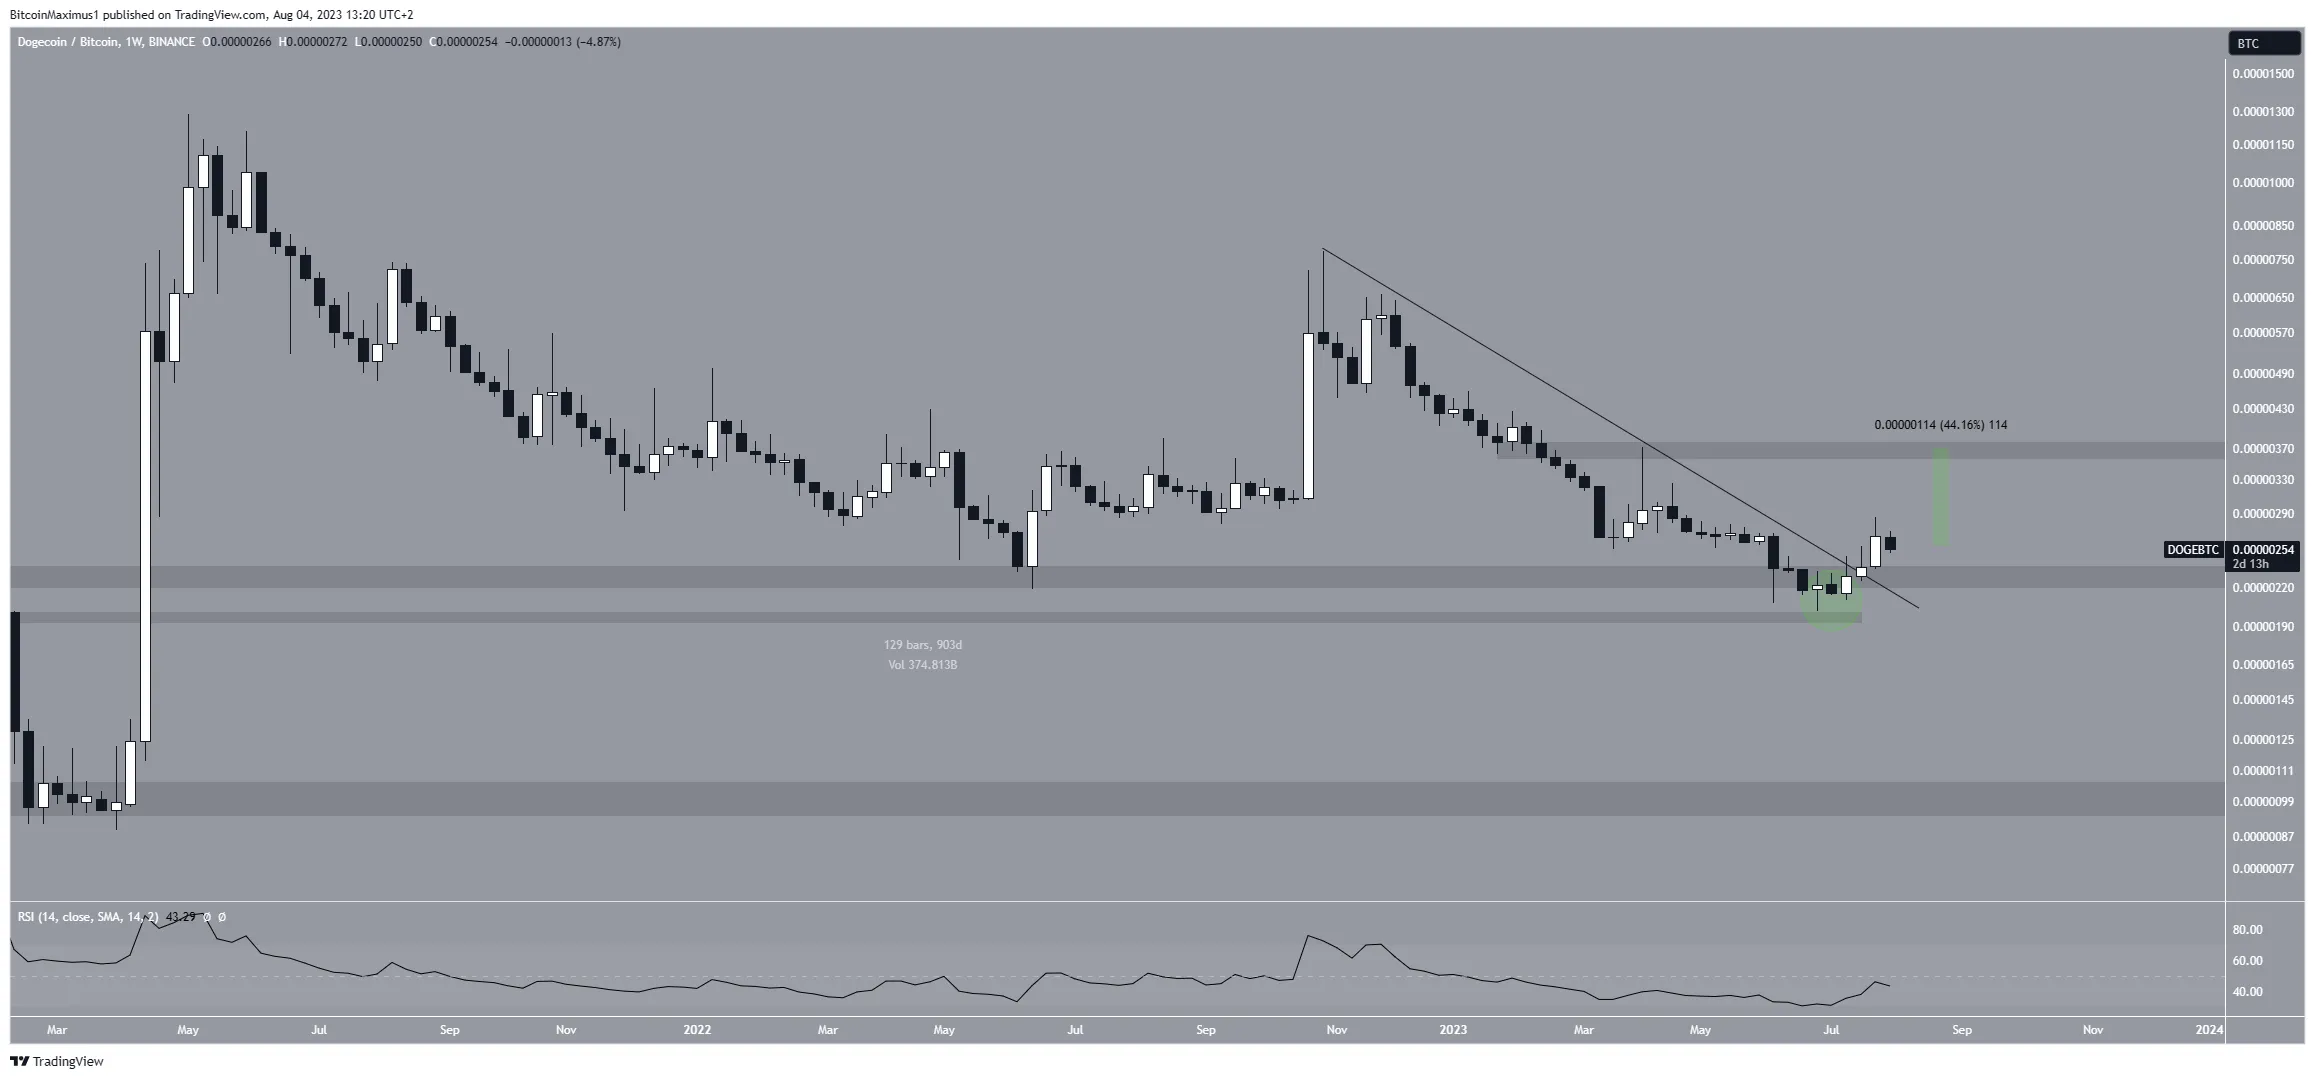
Firstly, the price reclaimed the 230 Satoshi area after previously deviating below it (green circle). Deviations and reclaims are decisive bullish movements that often lead to significant increases.
The importance of this move is increased by the fact that the area had been in place for 900 days at the time of the deviation.
The DOGE price broke out from a descending resistance line afterwards, further suggesting that the trend is bullish.
However, the RSI has yet to confirm the bullish trend. While the indicator is increasing, it is still below 50.
If the price continues to increase, the next resistance will be at 370 satoshis, 45% above the current price.

Despite this bullish Dogecoin price prediction, closing below the 230 Satoshi and $0.060 areas respectively will mean that the trend is still bearish. In that case, the price could fall to the long-term support at $0.060.
For BeInCrypto’s latest crypto market analysis, click here.
Disclaimer
In line with the Trust Project guidelines, this price analysis article is for informational purposes only and should not be considered financial or investment advice. BeInCrypto is committed to accurate, unbiased reporting, but market conditions are subject to change without notice. Always conduct your own research and consult with a professional before making any financial decisions.
[ad_2]
Source link


