Table of Contents
Introduction
Support and resistance levels are the foundation of technical analysis. Almost every strategy — from scalping to long-term investing — is built on the idea that markets remember where price previously reacted. These reactions are not random. They are the visible footprints of demand, supply, fear, and greed.
Instead of predicting the future, support and resistance help traders understand probabilities. They show where buyers and sellers previously made decisions and where they are likely to act again. This BTCUSA Learn guide explains how to identify these levels correctly, how to trade them in trending and ranging markets, and how to avoid the most common mistakes that cause beginners to lose money.
What Are Support and Resistance Levels
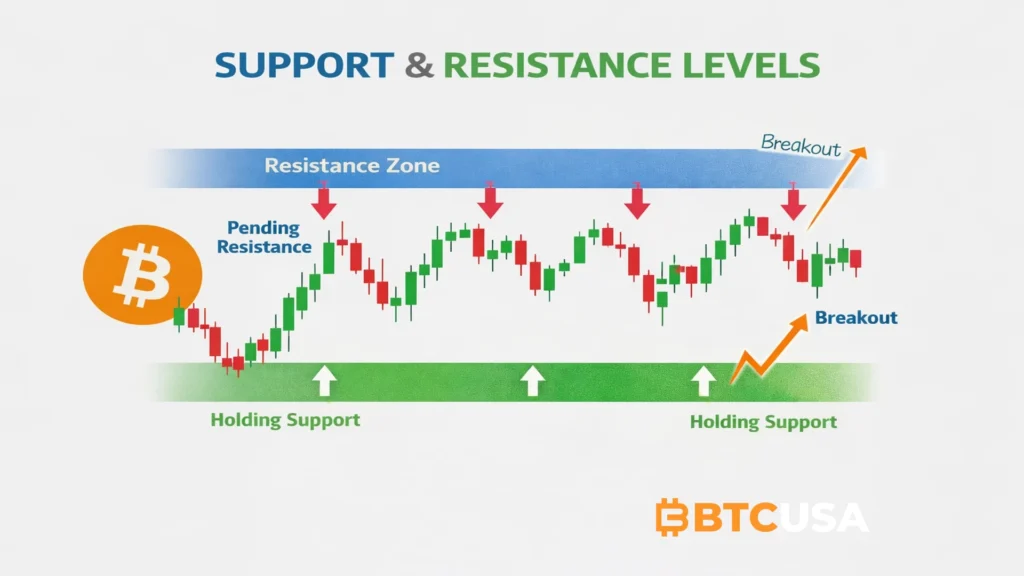
Support is a price zone where demand is strong enough to prevent further decline. When price approaches support, buyers often step in, creating bounces or consolidations.
Resistance is a price zone where selling pressure becomes dominant and prevents price from moving higher. At resistance, traders often take profits or open short positions, slowing or reversing price.
These levels are not exact numbers. They are areas where market participants consistently react. Thinking in zones rather than single price lines allows traders to adapt to market noise.
Why Support and Resistance Work
Markets are driven by human behavior. Traders remember pain and profit. When price revisits an area where strong moves occurred, emotions resurface.
Institutions and algorithms also place orders around the same zones, reinforcing their importance. The more times price reacts to a level, the more visible and self-fulfilling it becomes.
Support and resistance simplify market structure. Instead of chasing candles, traders wait for price to reach key areas where decisions actually matter.
How to Identify High-Probability Support Levels
Strong support zones usually appear near:
• Previous swing lows
• Areas of strong upward reversals
• Consolidation ranges followed by breakouts
• High-volume clusters
Practical method:
- Zoom out to the daily or 4H timeframe.
- Mark areas where price reversed multiple times.
- Use zones instead of single lines.
Example:
Bitcoin drops from $42,000 to $38,000 and bounces sharply. Weeks later, price revisits $38,000 and again finds buyers. That repeated reaction confirms a support zone rather than a coincidence.
How to Identify High-Probability Resistance Levels
Resistance often forms near:
• Previous swing highs
• Failed breakout attempts
• Long sideways consolidations
• Psychological levels like $50,000 or $100,000
Example:
Ethereum rallies to $2,100 several times but fails to break higher. Each rejection confirms $2,100 as resistance, turning it into a key decision zone.
Support and Resistance as Zones, Not Exact Prices
A common beginner error is expecting price to respect levels perfectly. In reality, markets often overshoot, undershoot, and fake out traders.
Using zones accounts for volatility and prevents premature entries. A good support or resistance zone includes candle bodies, wicks, and the surrounding area where reactions occur.
Trading Support and Resistance in Ranging Markets
In sideways markets, price oscillates between clear support and resistance.
Strategy:
• Buy near support
• Sell near resistance
• Avoid entries in the middle of the range
Example:
ETH trades between $1,800 and $2,100 for weeks. A trader buys near $1,800 after rejection and sells near $2,100 instead of chasing breakouts.
Trading Support and Resistance in Trending Markets
In trends, traders use support and resistance differently.
Uptrend:
• Buy pullbacks to support
• Avoid shorting resistance aggressively
Downtrend:
• Sell rallies into resistance
• Avoid buying weak support
This approach aligns trades with the dominant market direction.
Example: On the BTCUSDT daily chart, Bitcoin experienced a sharp sell-off in late November, dropping from the $105,000–$110,000 range into the $84,000–$86,000 zone. This area acted as strong support, where buyers stepped in aggressively and stopped the decline. Over the following weeks, price revisited this same zone multiple times, each time forming higher lows and showing visible rejection wicks. These repeated reactions confirmed the $84,000–$86,000 range as a key support zone rather than a random bounce.
After stabilizing, Bitcoin started to recover and approached the $94,000–$96,000 region — a level that had previously acted as resistance. Each attempt to move above this zone initially failed, with price being pushed back down, showing that sellers were still actively defending the area. These repeated rejections validated $94,000–$96,000 as a major resistance zone.

Breakouts and False Breakouts
Not every breakout leads to a trend. Many are traps designed to trigger stop losses.
High-quality breakouts often show:
• Strong candle close beyond the level
• Increased volume
• Retest of the broken zone
Example:
BTC breaks above $30,000 resistance with volume. After breakout, price pulls back to $30,000 and holds. Former resistance now acts as support, confirming the breakout.
False breakouts often occur when price briefly moves beyond a level but quickly returns back into the range. Traders who chase the move get trapped.
Role Reversal: Support Becomes Resistance
When price breaks below support, that level often becomes resistance later. Likewise, broken resistance frequently turns into support.
This role reversal reflects a shift in market sentiment and creates high-probability trade setups.
Liquidity Traps and Stop Hunts
Markets are designed to seek liquidity. Large players often push price slightly beyond obvious levels to trigger stop losses before reversing.
These fake breakouts are called stop hunts. Traders who enter too early get wiped out, while patient traders wait for confirmation and trade the reversal.
Combining Support and Resistance With Indicators
Support and resistance become more powerful when combined with:
• RSI for momentum
• Moving averages for trend
• Volume analysis for validation
Example:
A support zone aligned with rising volume and bullish RSI divergence is far more reliable than support alone.
How Resistance Turns Into Support in Real Market Conditions
One of the most powerful concepts in technical analysis is the role-reversal principle — when a former resistance level eventually becomes support. However, it is critical to understand that right after a breakout the level is not yet support. At that moment it is only a potential support zone and requires confirmation.
On the BTCUSDT daily chart, Bitcoin sold off sharply from the $110,000–$120,000 range and found a strong base in the $84,000–$86,000 zone. After multiple reactions from this area, price started forming higher lows, indicating that buyers were gradually taking control.
Later, Bitcoin pushed back into the $94,000–$96,000 region — a level that had repeatedly acted as resistance throughout December. Each rejection confirmed that sellers were still defending the zone, although their pressure was weakening.
When price first closed above this resistance, that alone did not mean the level had become support. At this stage the market is in uncertainty — the move may either develop into a trend reversal or turn into a classic false breakout.
Only after price:
– closes above the zone multiple times,
– holds above the level without sharp breakdowns,
– and shows buyer reactions on pullbacks,
can the level be considered confirmed support.
The next pullback into the $94,000–$96,000 area became the real validation. Instead of strong selling pressure, the market showed slowing downside momentum and renewed buying interest — this is the moment when resistance truly started turning into support.
From a trading perspective, this creates a high-quality structural setup:
– Entry is not taken on the breakout candle, but after confirmation that the zone is holding.
– Stop-loss is placed below the reclaimed level, because losing it invalidates the setup.
– Targets are set toward the previous high or the next resistance zone.
The biggest mistake beginners make is entering trades on the very first green candle above resistance. Without confirmation, most of these breakouts fail.
This example clearly demonstrates that support and resistance are not lines on a chart — they are evolving processes. Only confirmation transforms a level into a real trading edge.
Risk Management When Trading Levels
Support and resistance are tools, not guarantees.
Rules:
• Never risk more than a small percentage of capital
• Always use a stop loss
• Accept losing trades without revenge trading
• Keep position sizes consistent
Survival comes before profit.
Psychological Discipline and Emotional Control
Many traders know how to draw levels but still lose money due to emotions. Fear causes premature exits. Greed leads to overtrading.
Having predefined rules around support and resistance removes emotion from the process and replaces it with structure.
Practical Checklist Before Entering a Trade
• Is the level visible on higher timeframes
• Has price reacted here before
• Is the trade aligned with the trend
• Do I have confirmation
• Is my risk defined
• Is my reward worth the risk
If any answer is no, skip the trade.
Final Thoughts
Support and resistance are not about predicting the future. They are about understanding where probability shifts.
Traders who master these levels gain a framework that applies across crypto, stocks, and global markets. With patience, confirmation, and discipline, support and resistance become one of the most powerful tools in a trader’s arsenal.
BTCUSA Learn is built to give traders these foundations — not shortcuts, but skills that last.