
[ad_1]
Join Our Telegram channel to stay up to date on breaking news coverage
Bitcoin price has rallied more than 5% over the last 24 hours flashing shortly above $29,000 on Wednesday. At the time of writing, BTC was exchanging hands at $28,958 initiating a solid rebound as fresh concerns over the state of the United State’s financial industry emerged.
In recent developments, the First Republic Bank reported a remarkable decline in deposits that caused its stock price to plummet 50% within a day.
When this bank bites the dust, probably later this week, we will be closer to the mrkt realising the entire US banking deposit base is de-facto gteed by the USG.
Massively Inflationary, that is why $XAU and $BTC are rising on news that FRC is a dead bank walking. https://t.co/LjSgjT5AJt
— Arthur Hayes (@CryptoHayes) April 26, 2023
Drawing on Bitcoin’s response to the news, there is a potential for a sustained upside following a technical analysis of BTC’s price action in the four-hour timeframe.
Bitcoin Price Seeks A Return To $31,000
BTC was fighting immediate resistance from the 100-four-hour Simple Moving Average (SMA) at $29,103. A daily candlestick close above this level would see Bitcoin rise to collect the four-hour liquidity above it with the next resistance emerging from the $30,000 psychological level and later the $30,500 level.
Above that, BTC may climb to tag the April 14 swing high just above $31,000. Such a move would represent a 7.31% short-term rally from the current price.
BTC/USD Daily Chart
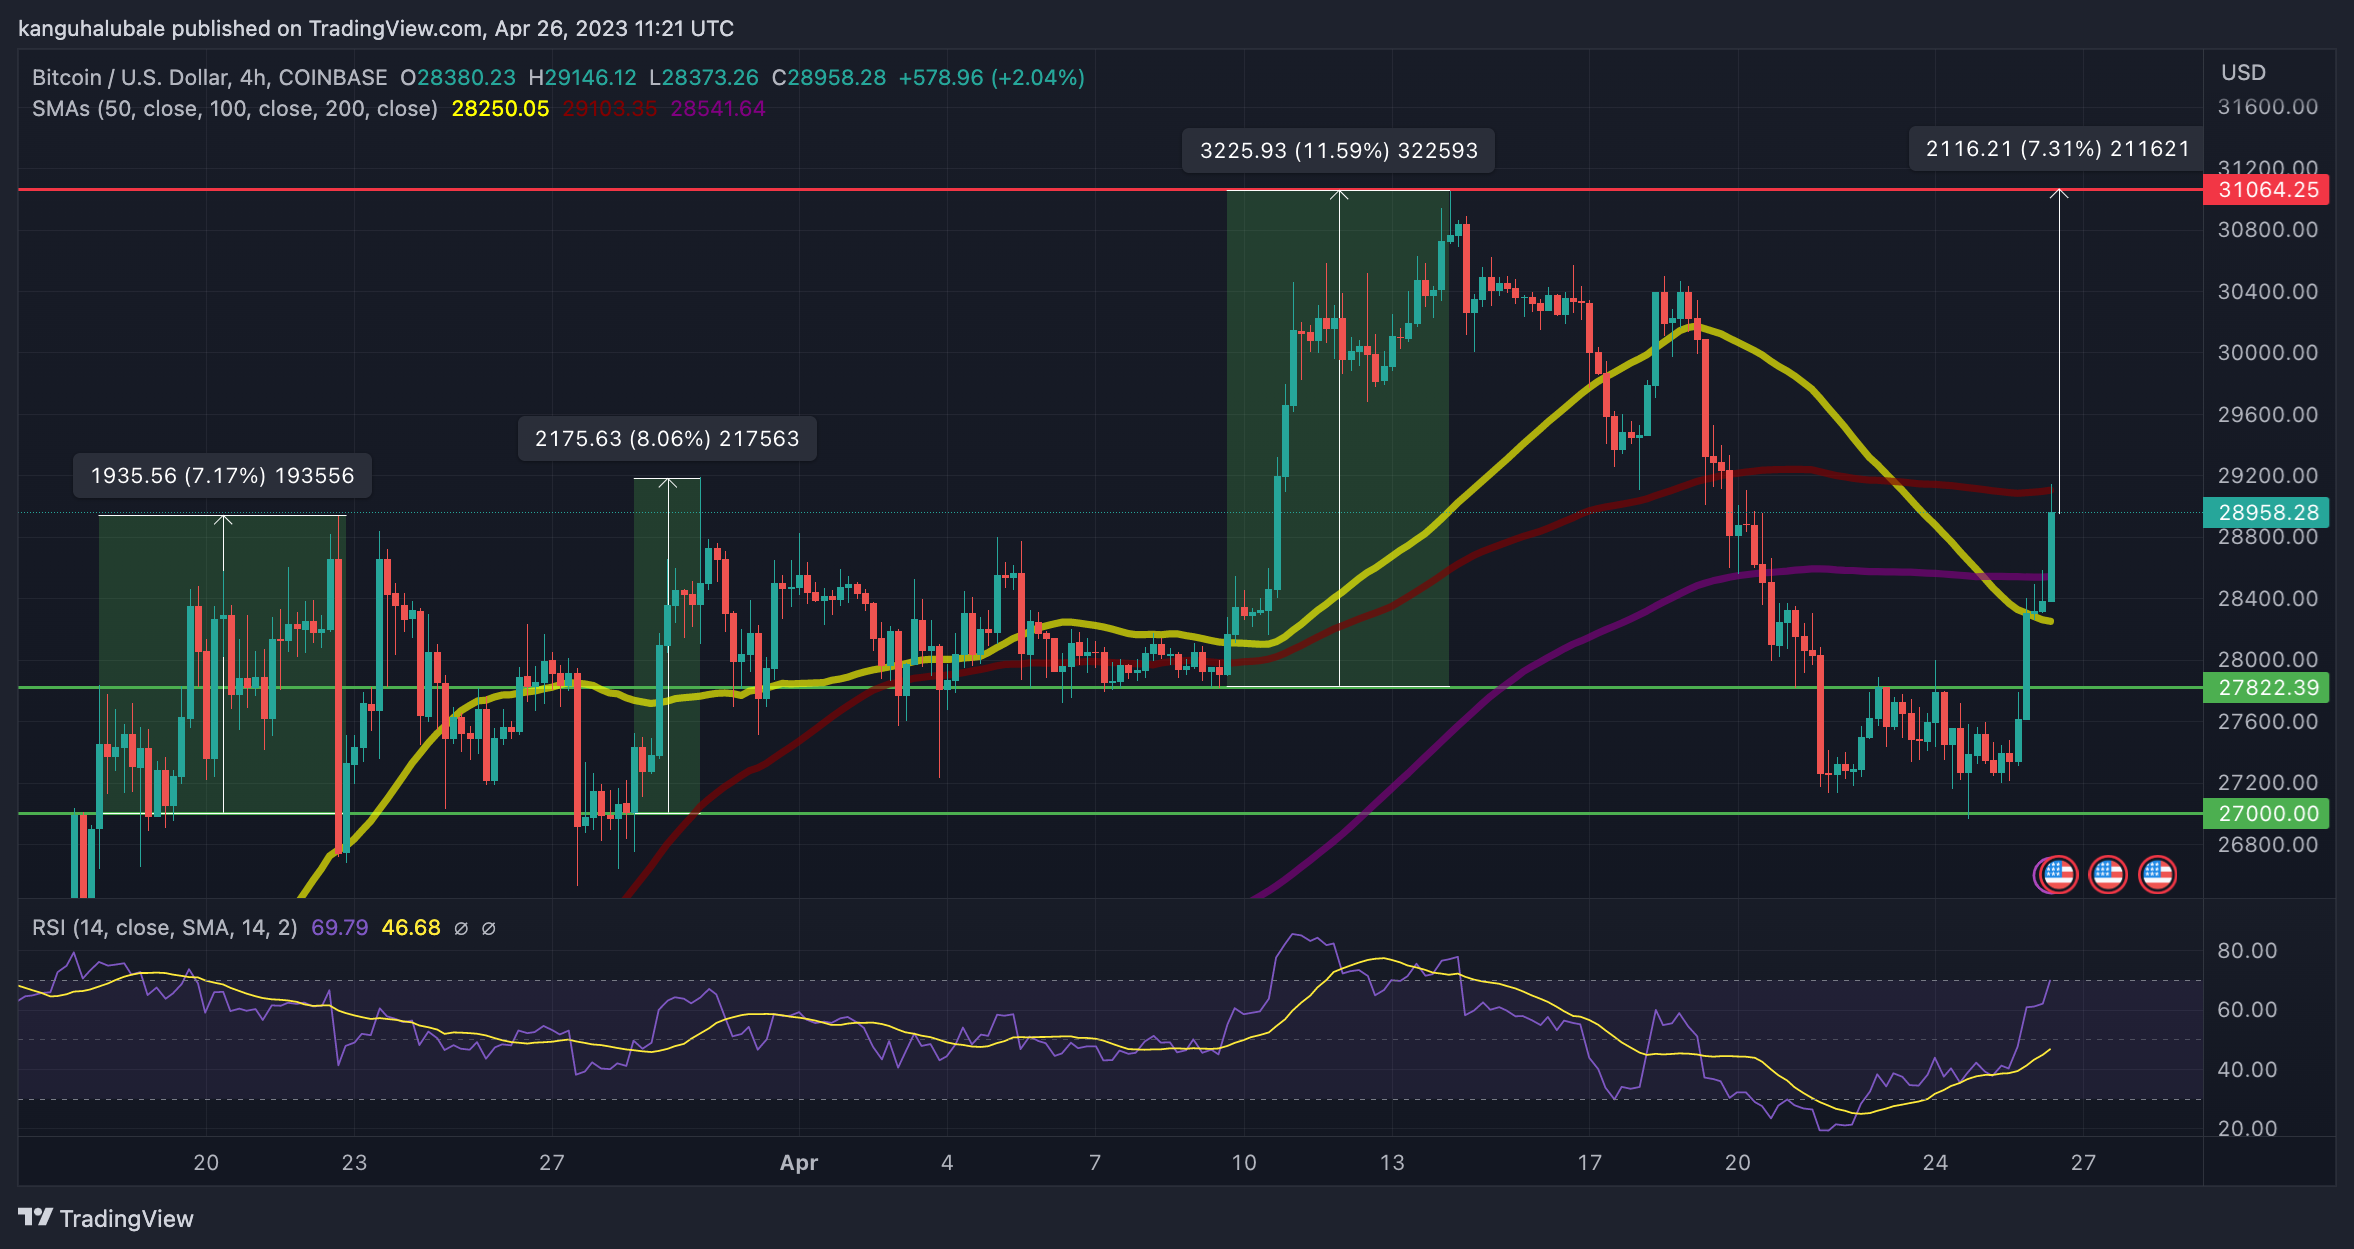
Supporting the positive outlook for the big crypto was the upward movement of the Relative Strength Index (RSI). The position of this trend-following indicator at 69 reinforced the buyers’ grip on the price, suggesting that the market conditions favored the upside.
Also validating Bitcoin’s upward narrative was the strong support that the price enjoyed on the downside. These were areas defined by the 200 SMA at $28,540, the 50 SMA at $28,250, and the $28,000 psychological level.
Perhaps the most significant defense for the flagship cryptocurrency was the four-hour buyer congestion zone stretching from $27,000 to $27,822. Note every time the price bounces off this zone it goes on to make a significant move upwards.
The price lifted off from the lower limit of this band twice in March, rising 7.17% and 8.08%, respectively. On April 9, Bitcoin bounced off the upper limit of this support zone, soaring 11.5% to set a 9-month high at $31,050.
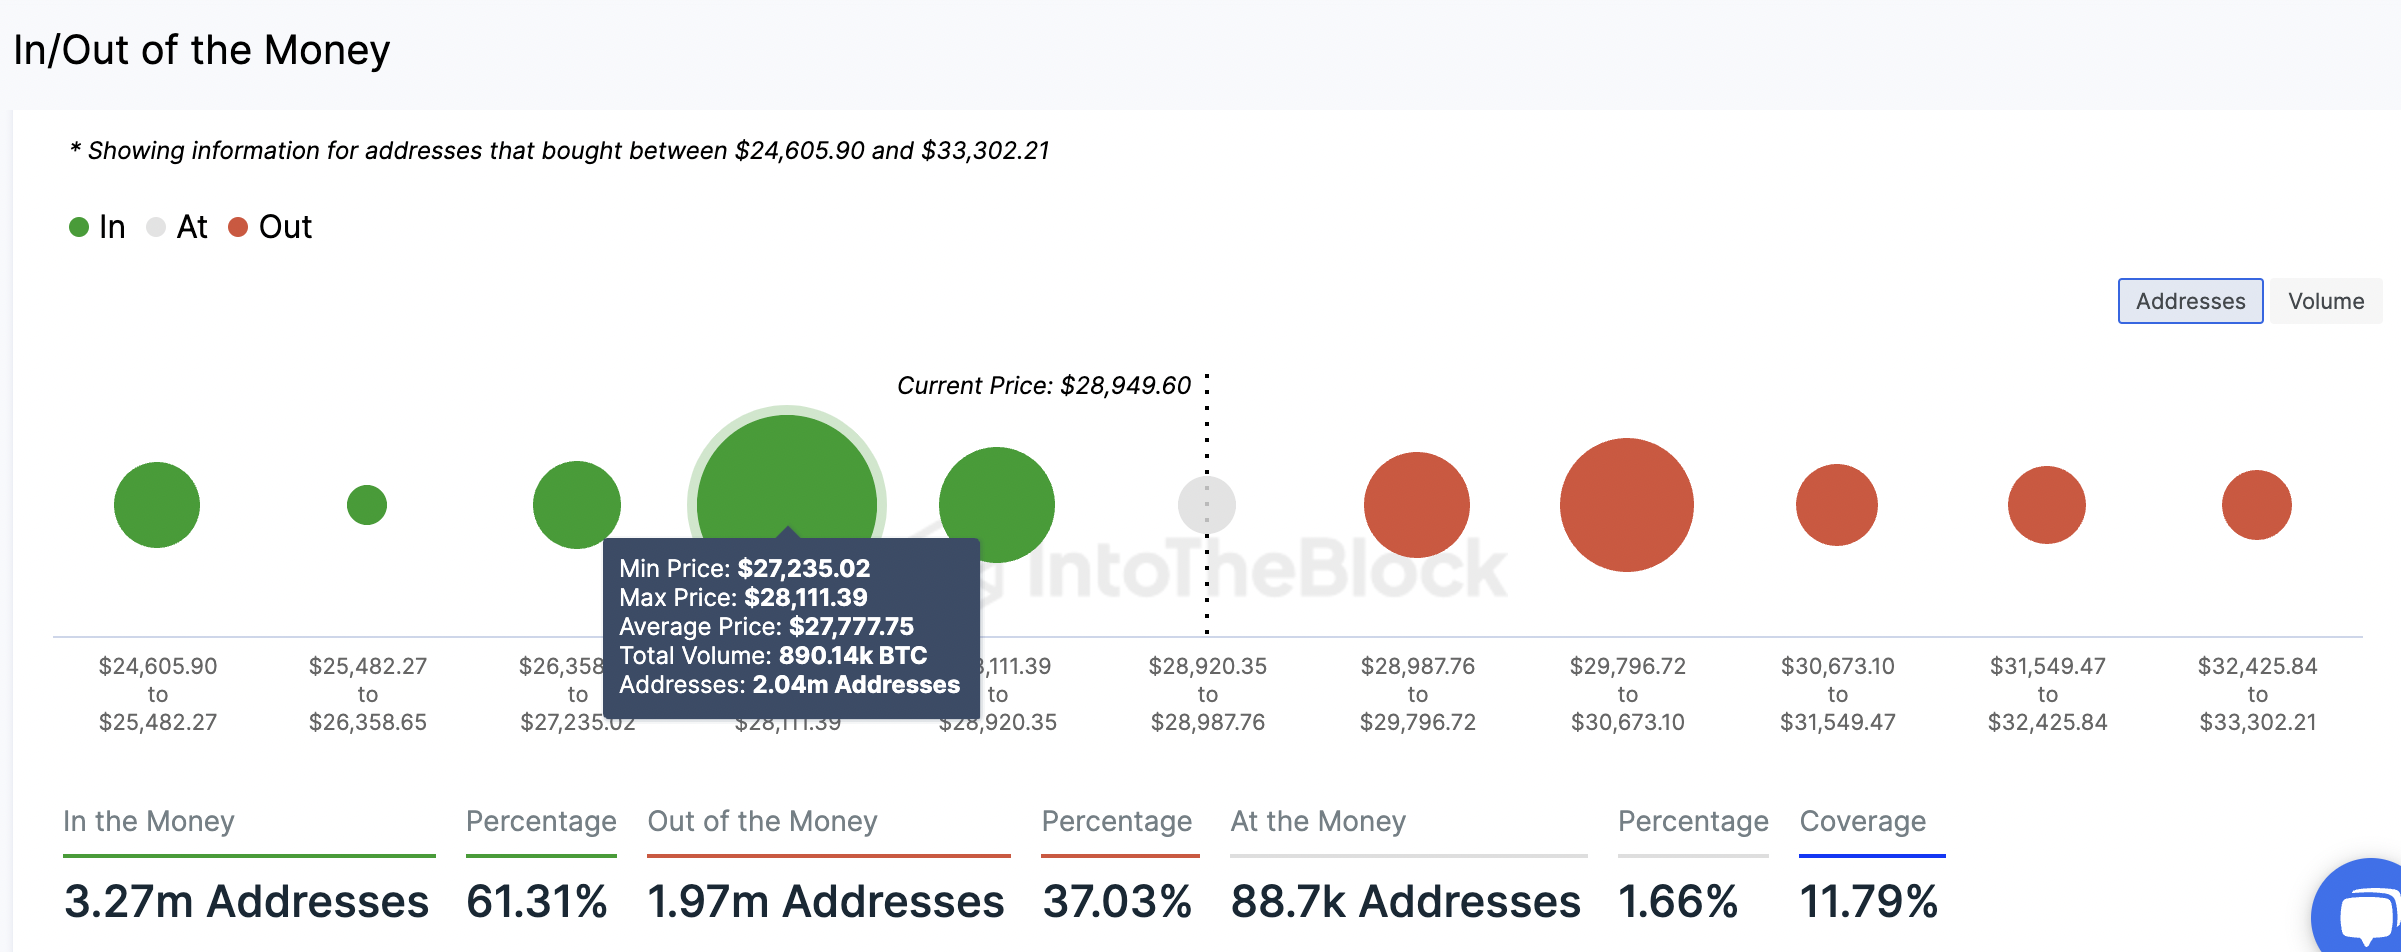
The significance of this support region is also reinforced by on-chain data from IntoTheBlock. Its In/Out of the Money Around Price (IOMAP) model shows that said level is similar to the $27,235 and $28,111 price range providing robust support for BTC on the downside.
This is where approximately 890,140 BTC were previously bought by about 2.04 million addresses. Any attempts to pull BTC below this point would be met by immense buying from this cohort of buyers who may want to increase their profits. This suggests that the path with the least resistance is on the upside.
Bitcoin IOMAP Chart
On the downside, the RSI painted near overbought conditions, suggesting that the ongoing recovery may soon run out of steam, occasioning a correction in the near term. If this happens, Bitcoin may drop from the current levels toward the defense zones named above with the downside capped at the lower limit of the demand zone at $27,000.
Market participants could expect the pioneer cryptocurrency to take a breather there before initiating another recovery.
Relates News:
Love Hate Inu – Newest Meme Coin

Decentralized Polling – Vote to Earn
Early Access Presale Live Now – Ends Soon
$7 Million Raised
Featured in Yahoo Finance, Bitcoinist
Mint Memes of Survey Results as NFTs
Staking Rewards
Viral Potential, Growing Community
Join Our Telegram channel to stay up to date on breaking news coverage
[ad_2]
Source link
Be the first to comment