Bitcoin Technical Outlook: Rising Wedge Breakdown Signals Mid-Cycle Reset Before the Next Leg Up
Bitcoin’s recent price action suggests that the market might be entering a critical mid-cycle correction phase — one that could redefine the path toward the next major rally. Based on the current weekly structure, BTC/USD has officially broken below its ascending wedge formation, hinting at a potential retest of lower support zones before resuming its broader uptrend.
The Rising Wedge Breakdown
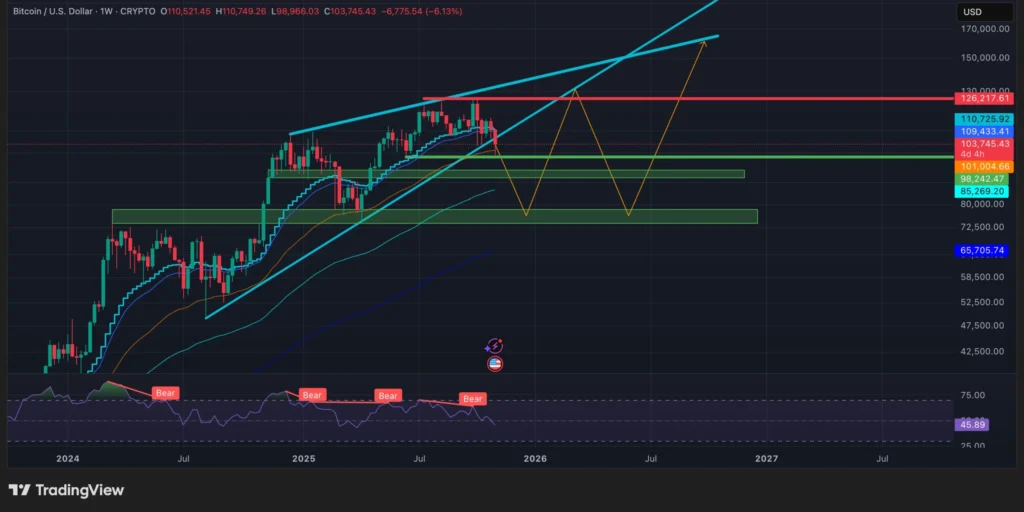
Since early 2024, Bitcoin has been trading within a rising wedge — a structure that often precedes corrective phases. The wedge’s lower boundary has acted as dynamic support for nearly 18 months, but the most recent weekly candle shows a decisive breakdown below it. Historically, such technical breaks often trigger liquidity sweeps toward previous accumulation zones.
The key technical zones to watch are as follows:
- Immediate support: $101,000 – $103,000 (current consolidation area)
- Deeper support zone: $85,000 – $90,000 (highlighted in green)
- Primary resistance: $125,000 – $126,000 (red zone)
A breakdown below $100,000 could confirm a larger mid-cycle correction, potentially taking BTC down toward the green support box before reaccumulation begins.
RSI Divergence and Momentum Shift
The weekly RSI continues to flash a sequence of lower highs, despite Bitcoin printing higher price peaks — a classic bearish divergence that has preceded each major cooldown over the past two years. Momentum exhaustion is visible, with the RSI hovering near the neutral 45–50 zone, suggesting further downside pressure before a sustainable reversal.
This setup mirrors the mid-cycle corrections of 2017 and 2020, both of which were followed by renewed parabolic phases once structural support held firm.
The Bullish Macro Context
Despite the short-term technical weakness, the broader market structure remains bullish on the macro scale. The logarithmic growth curve and long-term moving averages (MA100 and MA200) remain upward-sloping, indicating that Bitcoin’s long-term trend is intact. The current move should thus be viewed not as the start of a bear market, but as a healthy reaccumulation phase before the next expansion wave.
If the projected pattern (orange path on the chart) unfolds, Bitcoin may consolidate between $85,000 and $125,000 well into 2026 before embarking on a steep move toward the $180,000–$220,000 range in 2027. This projection aligns with both cycle theory and historical post-halving behavior.
Market Psychology and the Road Ahead
At this stage, the market is transitioning from euphoria to doubt, a typical psychological pivot in Bitcoin’s multi-year cycle. Whales and institutional players are likely rotating profits from the upper range, while long-term holders will view potential dips toward $85,000 as strategic accumulation opportunities.
Retail investors, on the other hand, may interpret this correction as the end of the bull market — yet historically, such disbelief phases often precede the most explosive rallies.
Conclusion
Bitcoin’s weekly chart paints a clear story: the wedge breakdown signals a mid-cycle reset, not a macro reversal. As long as BTC holds above the $85,000 support zone, the long-term bullish thesis remains valid.
A period of consolidation followed by a breakout above $126,000 could ignite the next parabolic phase — one that may propel Bitcoin toward uncharted territory near $200,000.
Until then, traders should remain patient, respect volatility, and prepare for a final shakeout before the ultimate ascent.