


[ad_1]
The BNB price trades inside a support area that has been in place for 875 days. The structure is crucial for maintaining a bullish trend.
The BNB price also trades in a short-term corrective pattern, further increasing the chances of a potential breakdown.
BNB Price Trades Near Range Bottom
The BNB price has traded in a range between $225 and $350 since May 2022. The range’s top and bottom have been touched numerous times during this time. These touches served to confirm the validity of the range.
The most recent rejection occurred in April 2023 (red icon). This led to the ongoing decrease towards the range low. BNB reached the range low in June 2023. The price bounced slightly afterward but has yet to initiate any sort of significant upward movement.
Since the support area has been in place for 875 days, a breakdown below it could trigger a sharp fall.
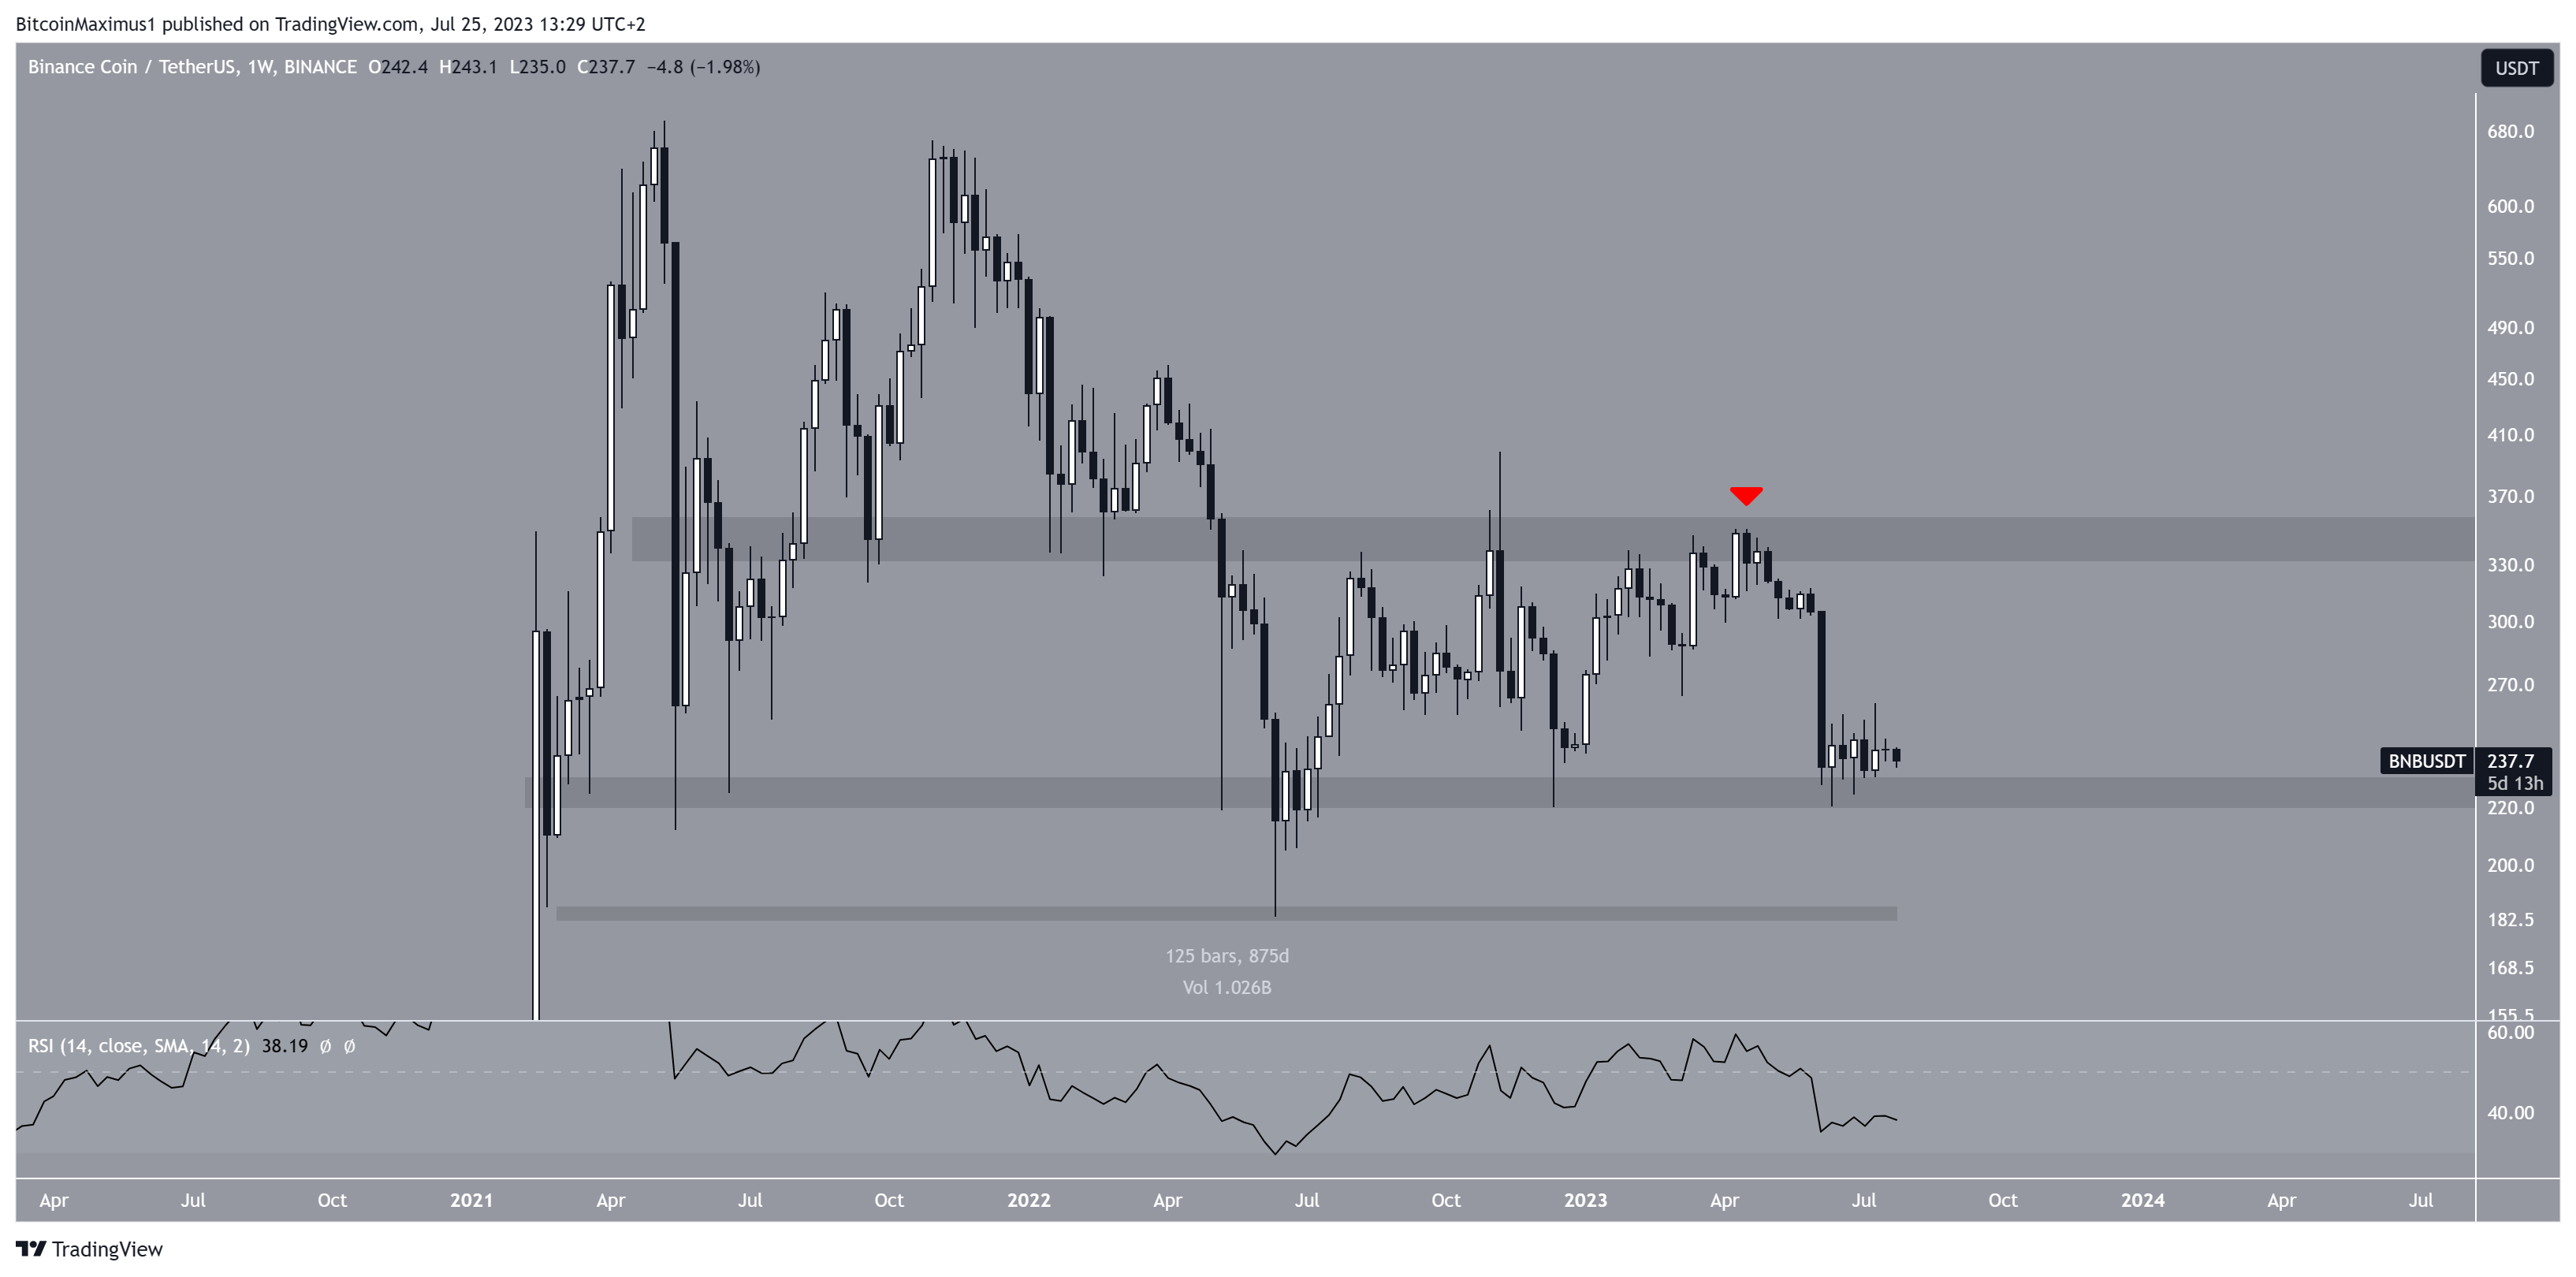
The weekly RSI provides a bearish reading, indicating that a breakdown and downward movement could follow. Market traders use the RSI as a momentum indicator to identify overbought or oversold conditions and to decide whether to accumulate or sell an asset.
Readings above 50 and an upward trend indicate that bulls still have an advantage, whereas readings below 50 suggest the opposite. The current reading of 35 is below the 50 line, a sign of a bearish trend.
BNB Price Prediction: Will Corrective Patten Lead to Breakdown?
The technical analysis from the daily time frame gives a bearish price prediction. The main reason for this is the price action, but the RSI also supports the possibility of a drop.
Since the June 10 bottom, the BNB price has traded inside an ascending parallel channel. This is considered a bearish pattern, meaning that it leads to breakdowns most of the time. The fact that the price trades in the channel’s lower portion further supports this possibility.
Next, the daily RSI is below 50 and has broken down from its ascending support line. This is also a sign associated with bearish trends. So, a price breakdown from the current pattern is the most likely future scenario. If this occurs, the BNB price will be down to $220.
However, it is worth mentioning that this will not cause a breakdown from the long-term $225 area since a weekly close considerably below it will be required to confirm the breakdown.
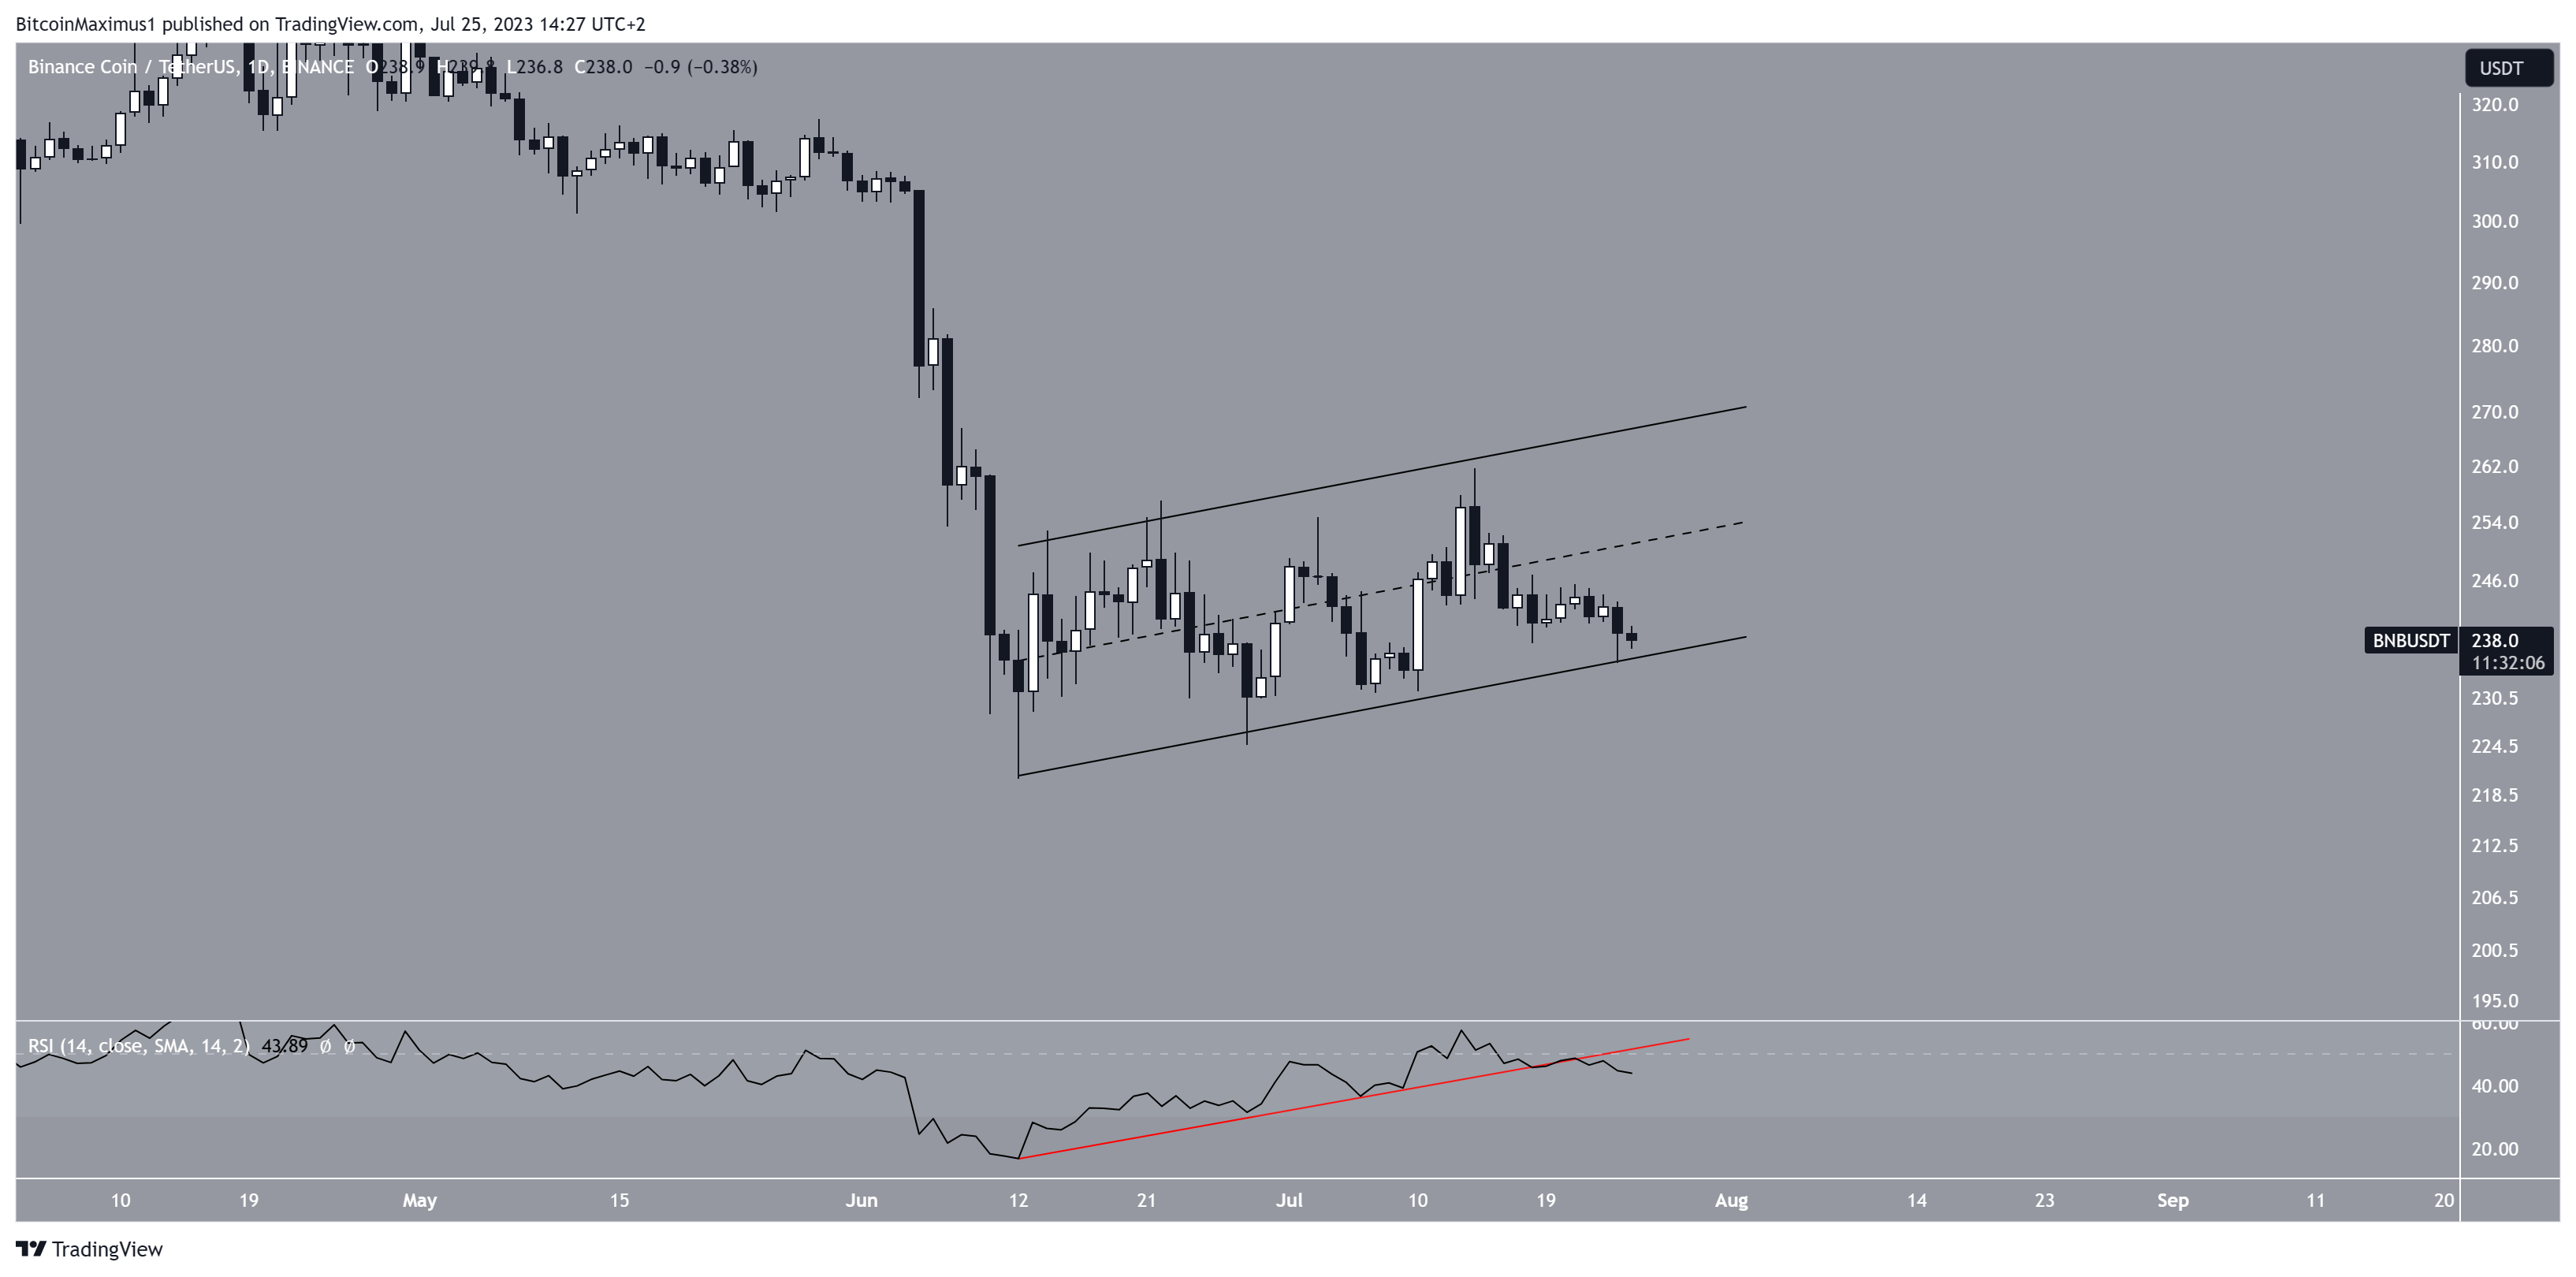
However, if the BNB price bounces at the channel’s support line and moves above the midline, an increase to the channel’s resistance line at $270 will be expected.
For BeInCrypto’s latest crypto market analysis, click here
Disclaimer
In line with the Trust Project guidelines, this price analysis article is for informational purposes only and should not be considered financial or investment advice. BeInCrypto is committed to accurate, unbiased reporting, but market conditions are subject to change without notice. Always conduct your own research and consult with a professional before making any financial decisions.
[ad_2]
Source link