
 Price Climbs 35% and Regains Top 50 Status")

[ad_1]
The Fantom (FTM) price has increased over the past 11 days and staved off a drop to a new yearly low.
The technical indicator readings for the future movement are still uncertain. While the price action and RSI are neutral/bearish, the wave count suggests the correction is complete.
Fantom Bounces After Significant Fall
The FTM price has decreased since creating a lower high on April 18. The decrease has been swift, devoid of any considerable bounces. This is considered a sign of weakness.
During the drop, FTM also fell below the $0.34 horizontal area, which is now expected to provide resistance. FTM fell to a low of $0.21 on June 10 before bouncing (green icon). The price has been on an upward movement since.

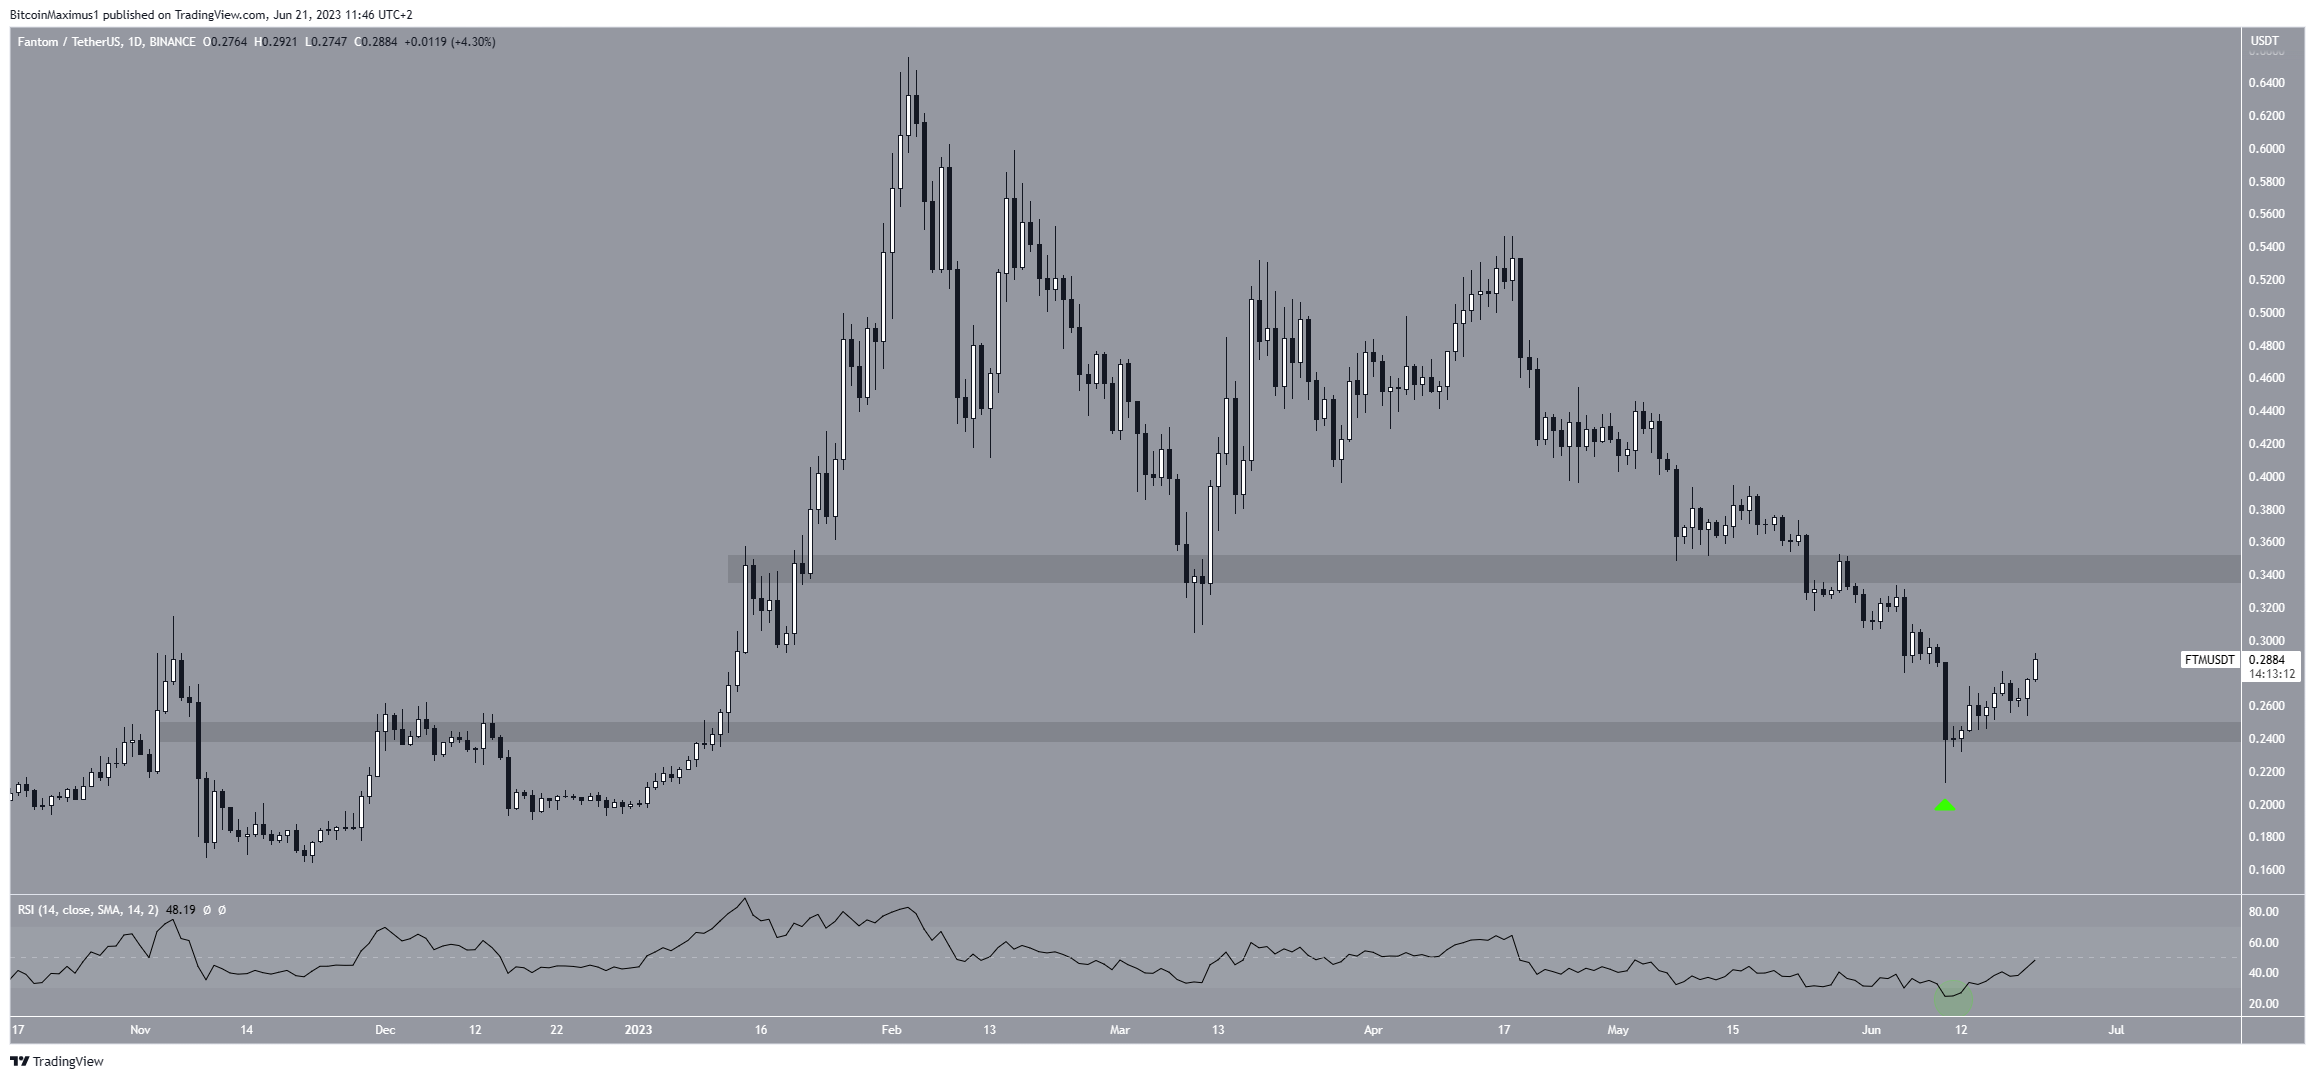
The weekly Relative Strength Index (RSI) supports the bounce but has not yet confirmed a bullish trend reversal yet. When evaluating market conditions, traders use the RSI as a momentum indicator to determine if a market is overbought or oversold and to decide whether to accumulate or sell an asset.
Bulls still have an advantage if the RSI reading is above 50 and the trend is upward. But, the opposite is true if the reading is below 50.
While the indicator is increasing and has moved outside of its oversold territory (green circle), it is still below 50. A decisive movement above 50 is needed to confirm the trend as bullish.
FTM Price Prediction – Is the Correction Complete?
A closer look at the technical analysis from the daily time frame suggests that the FTM price might have completed an A-B-C corrective structure (black).
The corrective structure is recognized as an Elliot Wave theory pattern, a tool technical analysts use to identify recurring long-term price patterns and investor psychology to determine the trend direction.
If the count is correct, the FTM price has completed its correction and has now begun a new upward movement. The pattern will be confirmed if FTM moves above the wave a low (red line) of $0.31 since the overlap would suggest that the drop was corrective.
Additionally, the fact that waves A:C has a nearly 1:1 ratio supports the legitimacy of the pattern.
If the count is correct, the Fantom price will increase to at least $0.54 and possibly move to a new yearly high.
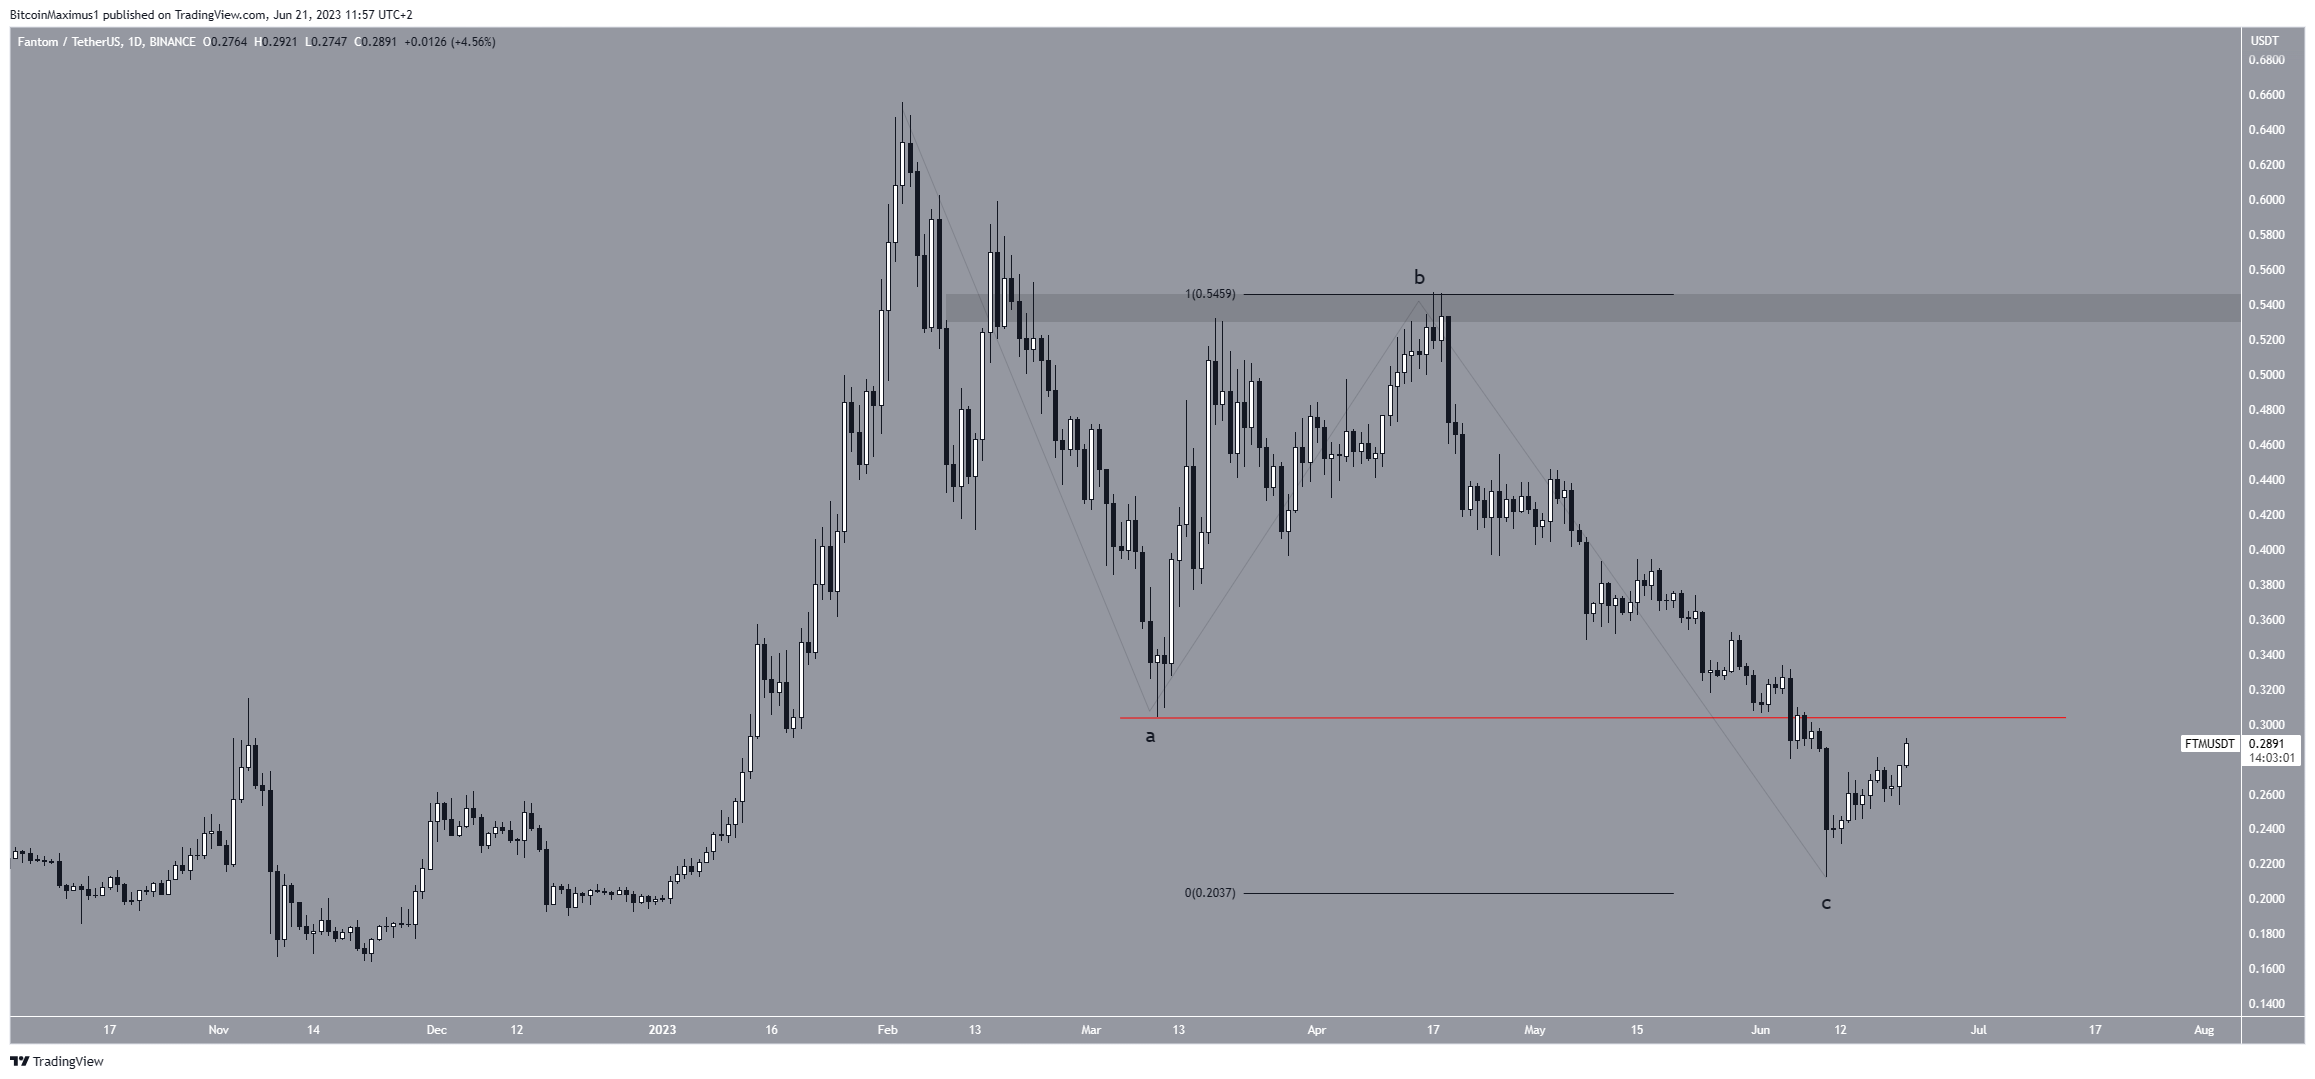
However, despite this bullish FTM price prediction, a decrease below last week’s low of $0.31 will mean that the trend is still bearish.
In that case, the drop would continue towards a new yearly low and the $0.10 region.
For BeInCrypto’s latest crypto market analysis, click here.
Disclaimer
In line with the Trust Project guidelines, this price analysis article is for informational purposes only and should not be considered financial or investment advice. BeInCrypto is committed to accurate, unbiased reporting, but market conditions are subject to change without notice. Always conduct your own research and consult with a professional before making any financial decisions.
[ad_2]
Source link