
 Price: Endless Slide or Reversal?")

[ad_1]
The Polygon (MATIC) price has increased since June 10, creating two higher lows and increasing by 30%.
Despite this upward movement, readings from both long- and short-term time frames show that a lot still needs to be done for the price to confirm a bullish trend reversal.
Polygon Price Trades in Horizontal Range
The weekly time frame technical analysis for MATIC gives a bearish outlook for numerous reasons.
The bearish signs started once the price broke down from a long-term ascending parallel channel. This suggested that the previous upward trend was complete, and a new bearish trend had now begun.

Then, the rate of decrease accelerated at the beginning of June, causing a breakdown from the $0.75 support area and taking the price to the $0.53 horizontal support level. The MATIC price is now trading between these two levels.
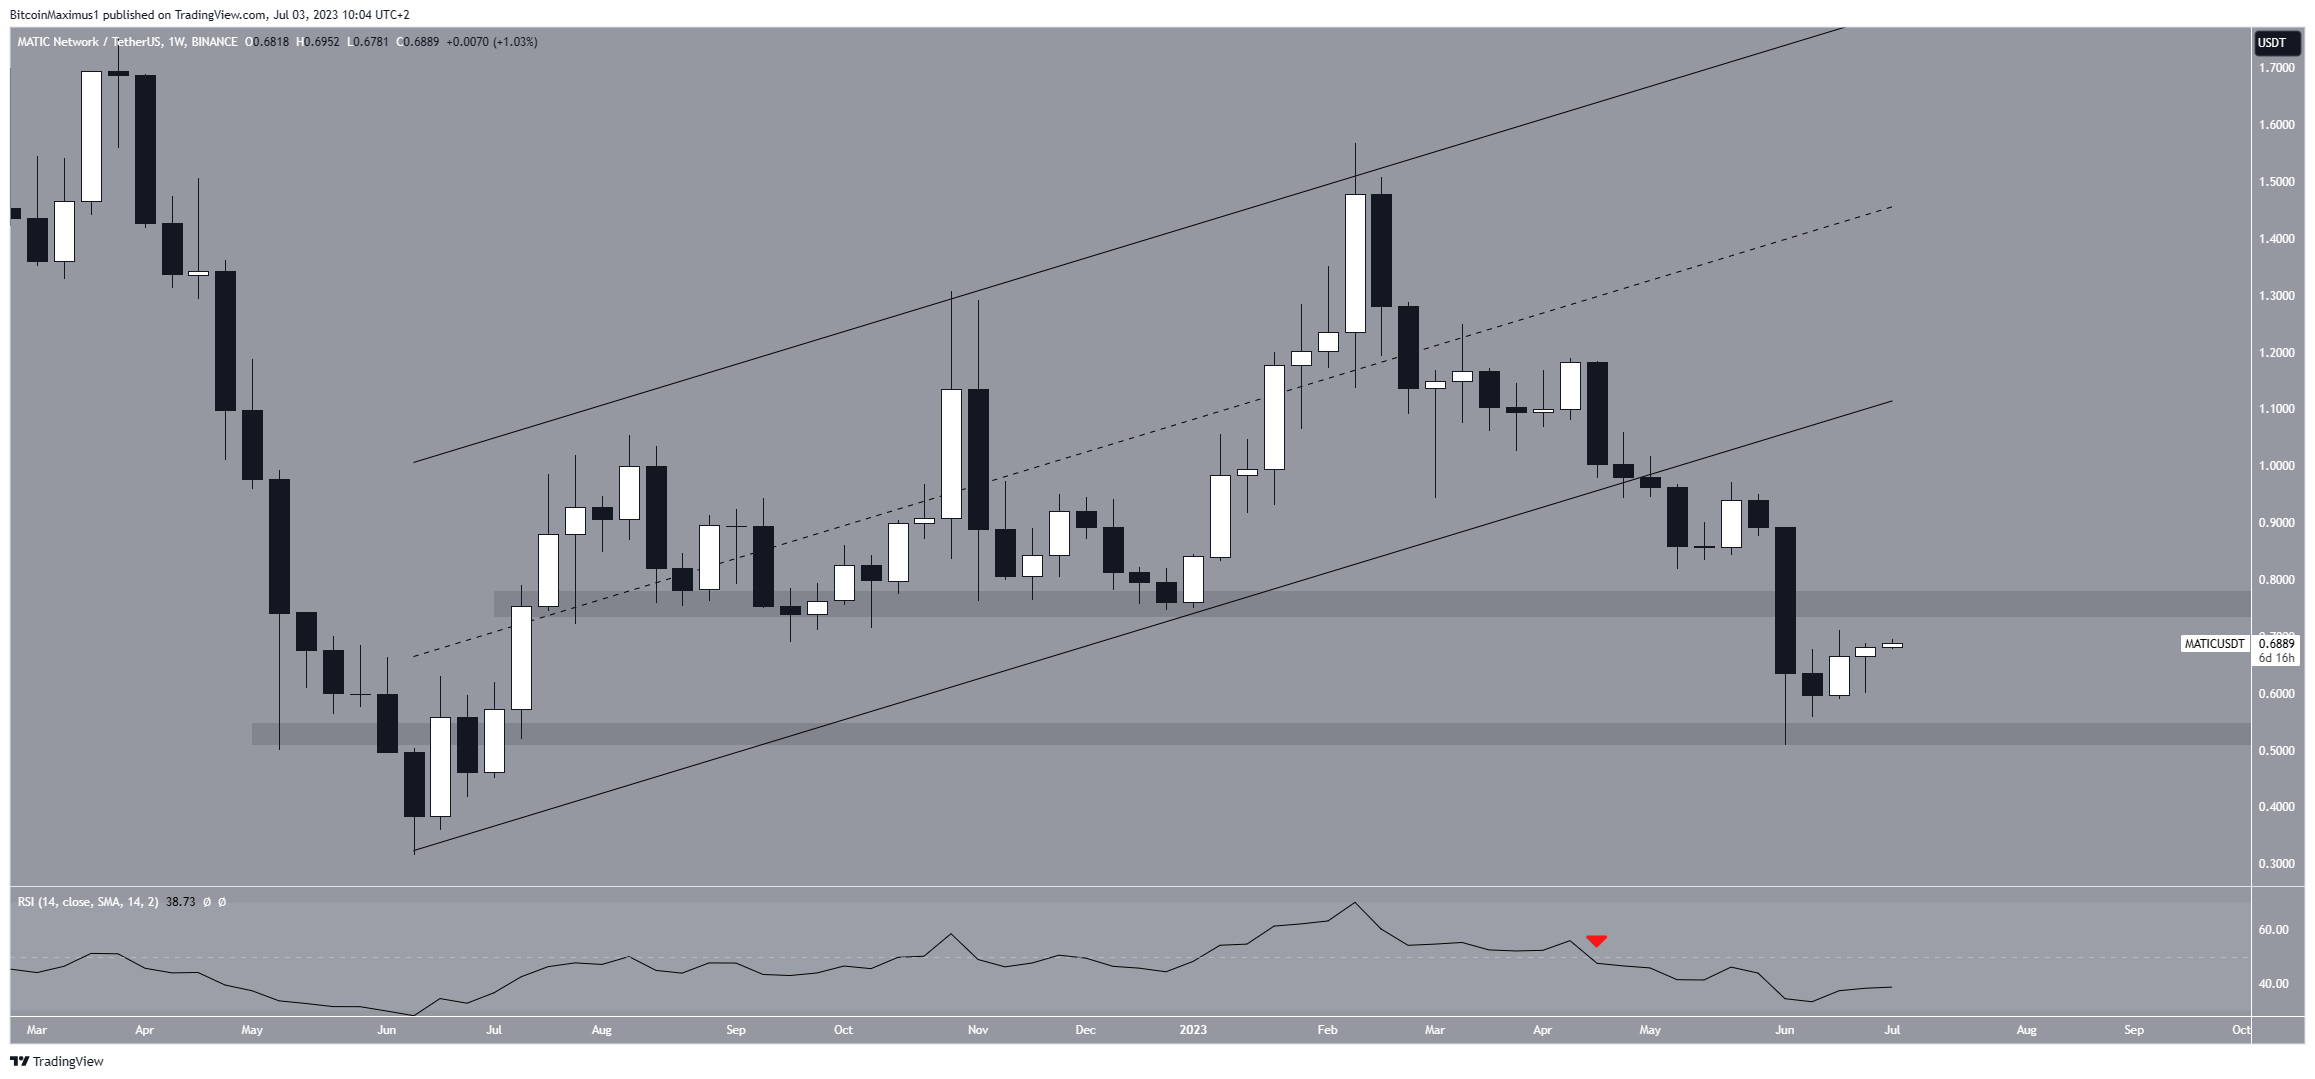
The weekly Relative Strength Index (RSI) is also bearish, supporting the continuation of the decrease. With the RSI as a momentum indicator, traders can determine whether a market is overbought or oversold and decide whether to accumulate or sell an asset.
Bulls have an advantage if the RSI reading is above 50 and the trend is upward, but if the reading is below 50, the opposite is true. The RSI is below 50 (red icon) and declining, indicating a downward trend.
The indicator fell below 50 at the same time the price broke down from the channel, legitimizing the breakdown.
Will MATIC Price Manage to Clear Resistance?
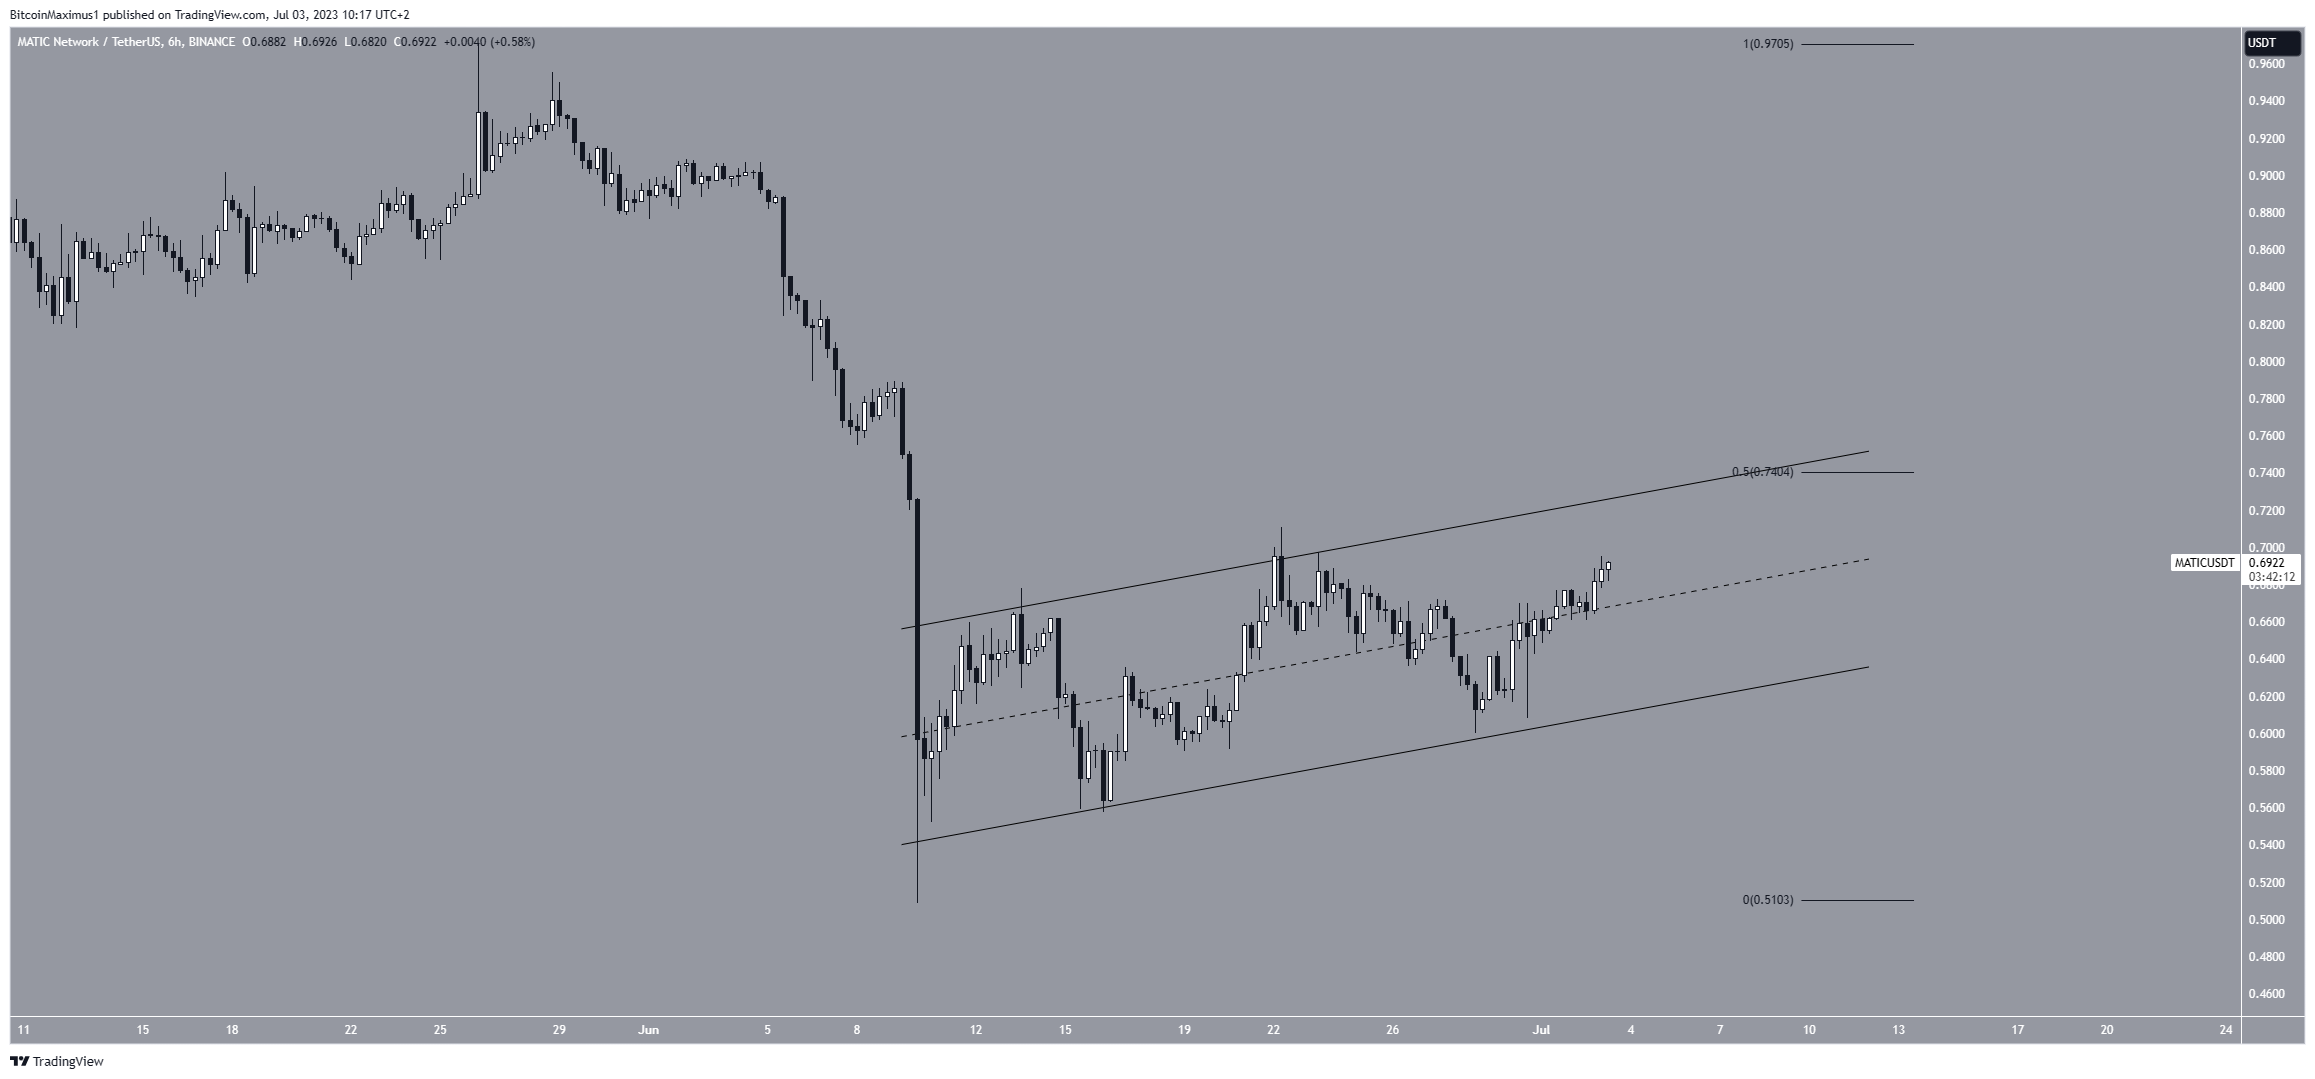
The short-term six-hour time frame shows that the MATIC price has created several higher lows. These can be the first signs of a bullish structure.
However, the price action also offers bearish signs, namely the presence of an ascending parallel channel. As evidenced by the weekly time frame, such channels usually contain corrective movements and lead to price breakdowns.
Even though the MATIC price currently trades in the upper portion of the channel, the channel’s resistance line coincides with the 0.5 Fib retracement resistance level at $0.74.
According to the Fibonacci retracement levels theory, following a significant price change in one direction, the price is expected to partially return to a previous price level before continuing in the same direction.
So, it is likely that the entire movement is just a relief rally in response to the previous decrease.
If this is the case, the MATIC price will increase to a maximum of $0.75 before crashing to the long-term $0.53 support level.
Despite this bearish MATIC price prediction, breaking out from the channel will mean that the trend is still bullish.
Since the $0.75 resistance is both a Fib and long-term horizontal resistance area, clearing it will confirm the bullish trend reversal.
For BeInCrypto’s latest crypto market analysis, click here.
Disclaimer
In line with the Trust Project guidelines, this price analysis article is for informational purposes only and should not be considered financial or investment advice. BeInCrypto is committed to accurate, unbiased reporting, but market conditions are subject to change without notice. Always conduct your own research and consult with a professional before making any financial decisions.
[ad_2]
Source link