[ad_1]
The Ethereum (ETH) price bounced significantly last week, temporarily ending a downward movement that has been ongoing since April.
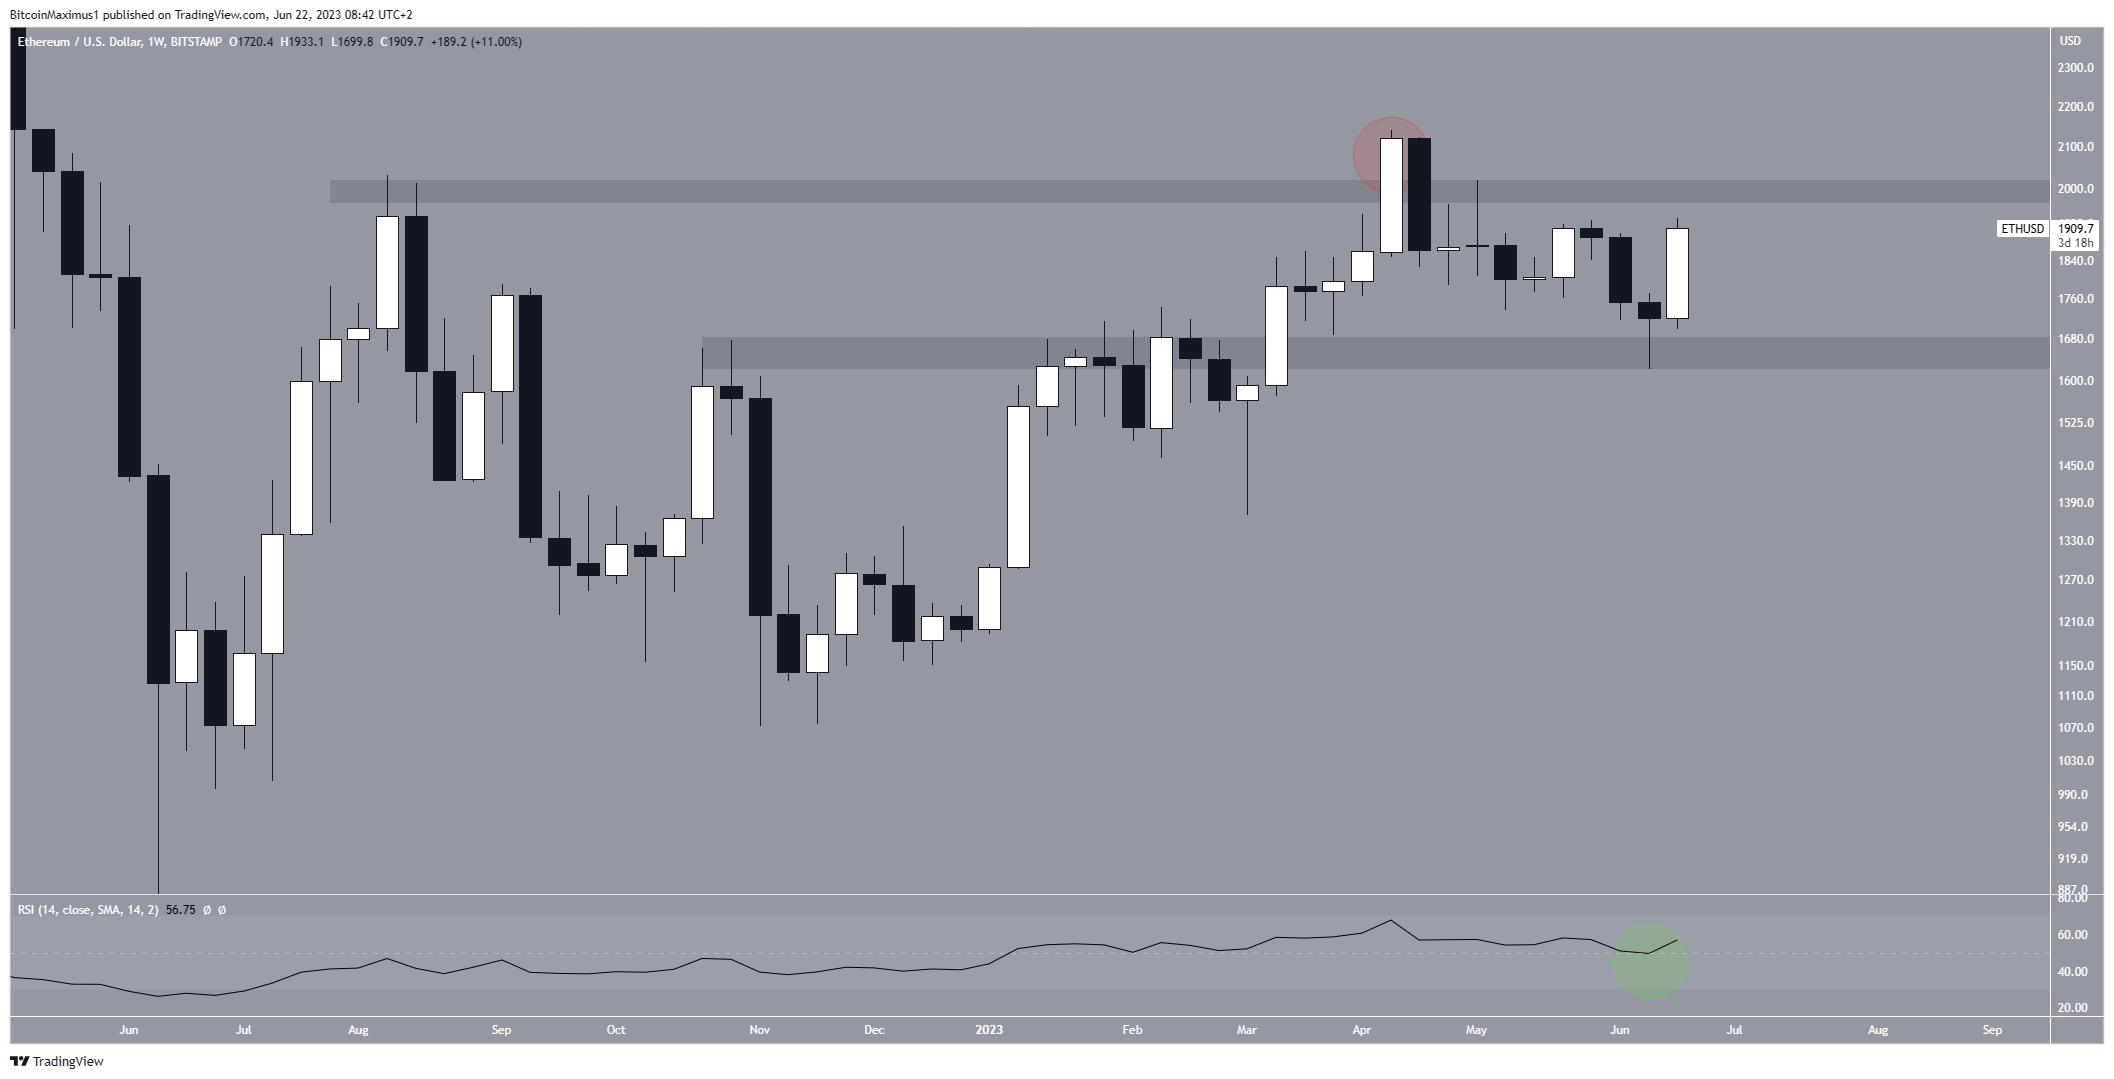
The ETH price is now trading in a horizontal range between $1,650-$1,950. Due to its short-term pattern, moving towards the range high and eventual breakout is the most likely scenario.
Ethereum Price Bounces After Sell-Off
ETH is the native token of the Ethereum blockchain, created by Vitalik Buterin. The weekly time frame outlook for the ETH price gives a mixed sentiment due to conflicting readings from the price action and technical indicators.
The price seemingly broke out from the $1,950 horizontal resistance area at the beginning of April. However, the breakout turned out to be illegitimate. The price fell the next week and has decreased since (red circle).
Last week, ETH reached a low of $1,622 and bounced, validating the $1,650 horizontal area as support. Now, the price trades in a range between $1,650 and $1,950.

The weekly Relative Strength Index (RSI) supports the bounce, though it is at a critical level. The RSI is a tool traders use to assess whether a market is overbought or oversold, helping them decide whether to accumulate or sell an asset.
Readings above 50 and an upward trend indicate that bulls still hold an advantage, while readings below 50 suggest the opposite. Once the price bounced, the RSI also bounced at the 50 line (green circle), a sign of a bullish trend.
However, the indicator has not begun an upward movement yet. Thus, the possibility that it will crash below 50 still remains.
ETH Price Prediction: Is the Correction Complete?
The technical analysis from the short-term daily time frame offers a more decisively bullish Ethereum price prediction. The main reasons for this come from the price action and the wave count.
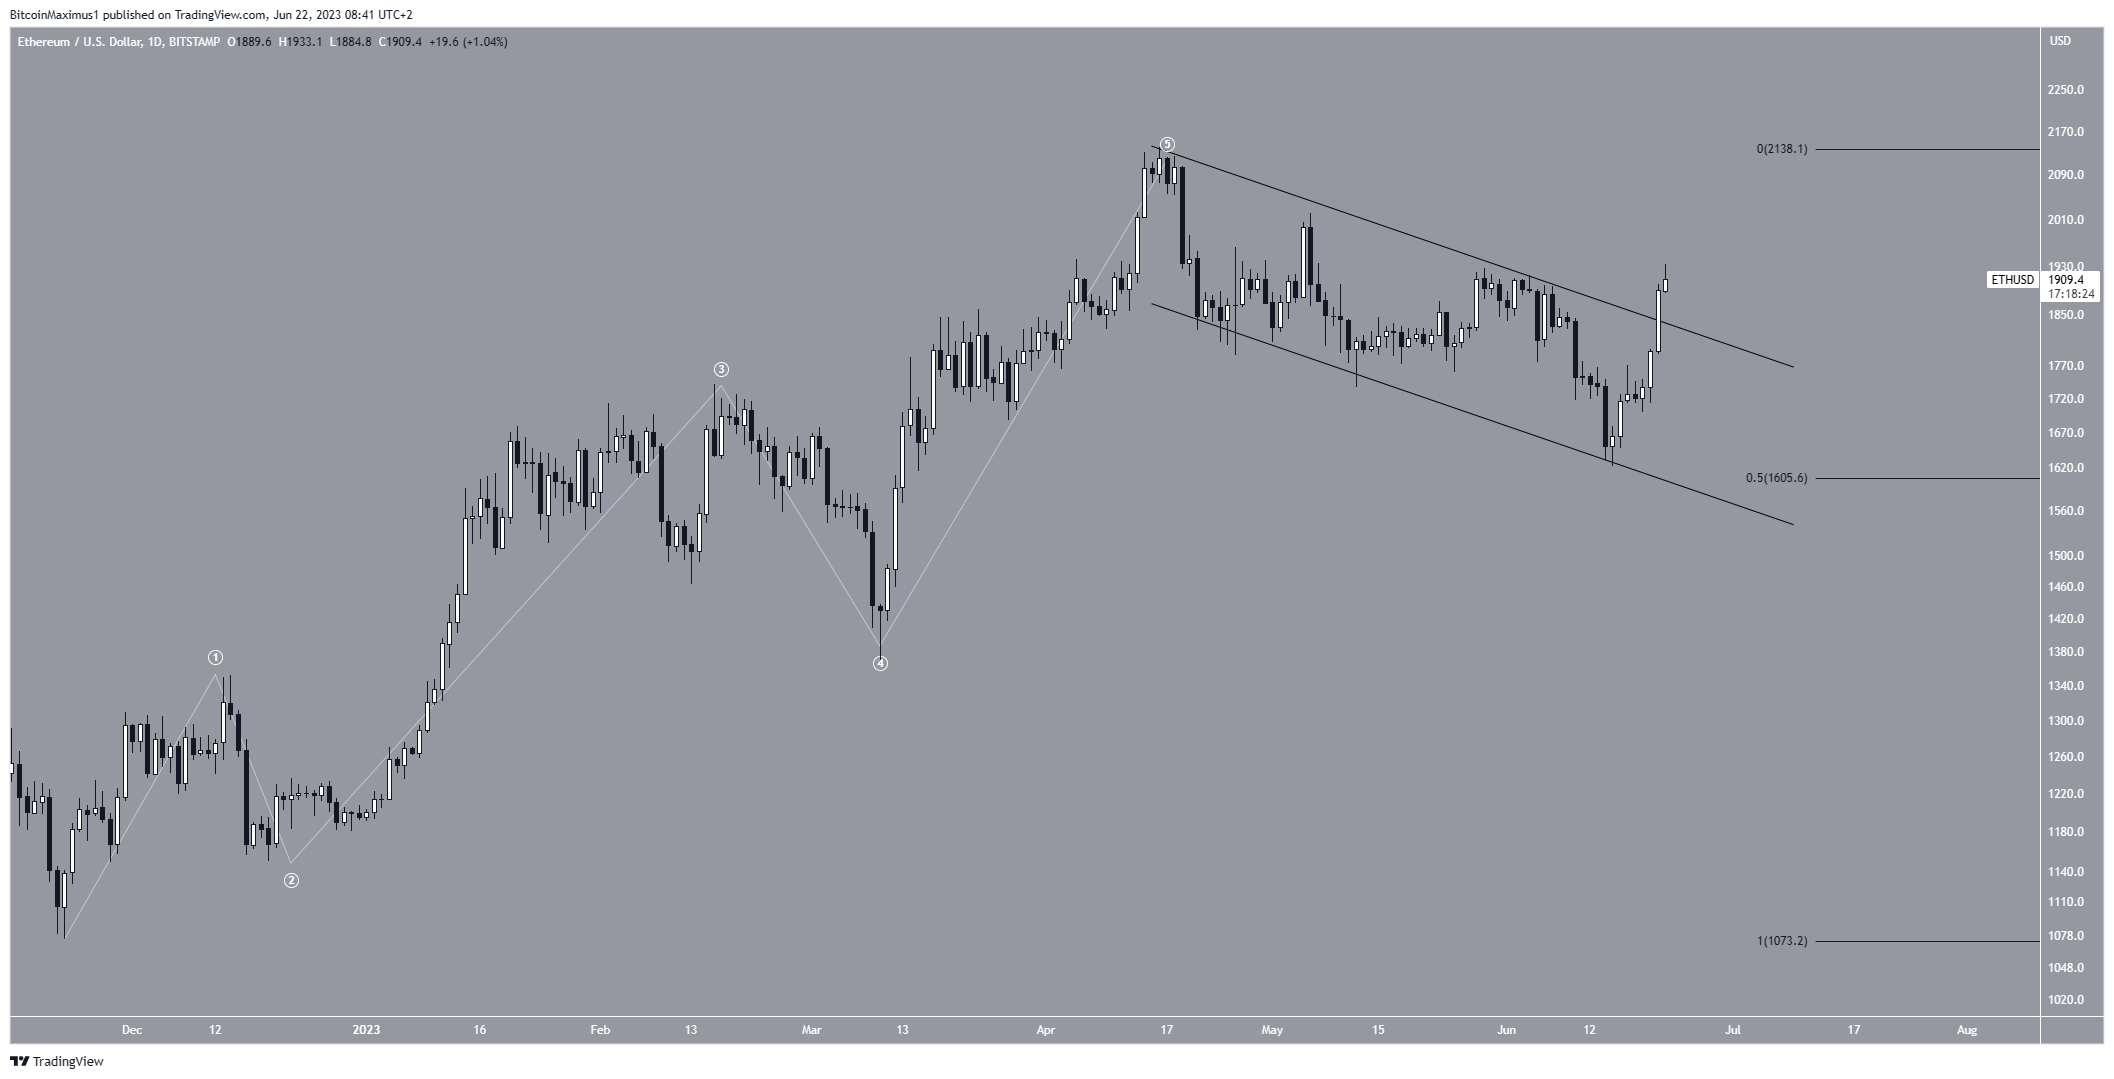
The most likely wave count suggests that the price completed a five-wave increase (white), leading to the yearly high on April 17. Since then, it has fallen inside a descending parallel channel.
Such channels usually contain corrective structures. Since a correction follows a five-wave increase, the movement inside the channel is likely corrective. This is also supported by the price bouncing at the 0.5 Fib retracement support level.
The June 21 breakout from the channel confirmed that the correction is complete. Thus, the ETH price is expected to increase to the next long-term resistance near $2,500.

Despite this bullish ETH price prediction, a fall inside the channel will invalidate the bullish wave count and suggest that ETH is in a bearish trend.
In that case, a drop to $1,200 will be the most likely outcome.
For BeInCrypto’s latest crypto market analysis, click here.
Disclaimer
In line with the Trust Project guidelines, this price analysis article is for informational purposes only and should not be considered financial or investment advice. BeInCrypto is committed to accurate, unbiased reporting, but market conditions are subject to change without notice. Always conduct your own research and consult with a professional before making any financial decisions.
[ad_2]
Source link


