


[ad_1]
Stacks price has declined 4% in the past 24 hours and is -15% this past 30 days.
STX currently trades near $0.78, and has a key supply zone near the psychological $1.00 level.
The price of STX rose sharply in February and March as the Ordinals hype hit the market.
The price of Stacks (STX) made another higher low move on Wednesday, trading to highs of $0.82 after surging double digits alongside Bitcoin (BTC). The upside followed the crypto market’s upward reaction to the US Federal Reserve’s interest rate hike.
But as the FOMC tide cools, STX is down 4% in the past 24 hours, cutting weekly gains to just 5% and wiping out gains from key price bursts in April.

Will Stacks go back up after the recent dump?
Stacks (STX) is a digital asset that has shown considerable fluctuations in price in the past few weeks. As CoinJournal highlighted in this article, the main driver of Stacks price in February was the strong interest in Ordinals, a platform for Bitcoin inscriptions (crypto assets similar to NFTs).
Stacks, which brings the power of smart contracts to Bitcoin, also surged in March as whales loaded up on the native STX.
As seen on the weekly chart below, STX/USD has been constrained between robust support at $0.64 and new resistance near $1.33 since 20 February. The coin is up 5% this week but is in the red on the monthly chart after today’s declines helped erase gains made earlier in the year. STXUSD is down nearly 15% over the past 30 days.
Incidentally, STX rose 122% in one week in February and another 51% over seven days in mid-March. So the question is: will Stacks go back up after retreating from year-to-date highs above $1.32?
The surge in Bitcoin ordinals, which on-chain data shows reached over 3.5 million this week, suggests interest in the inscriptions is still high. The activity on the Ordinals Protocol and other layer 2s on the Bitcoin blockchain and the potential uptick in BTC price are likely to be major catalysts of upside momentum for the altcoin.
Below is the outlook for Stacks price from a technical perspective.
Stacks price: short term outlook for STX
For a short-term technical outlook for STX, we can look at its weekly chart focusing on the Relative Strength Index (RSI), Moving Average Convergence Divergence (MACD), and Fibonacci retracement levels.
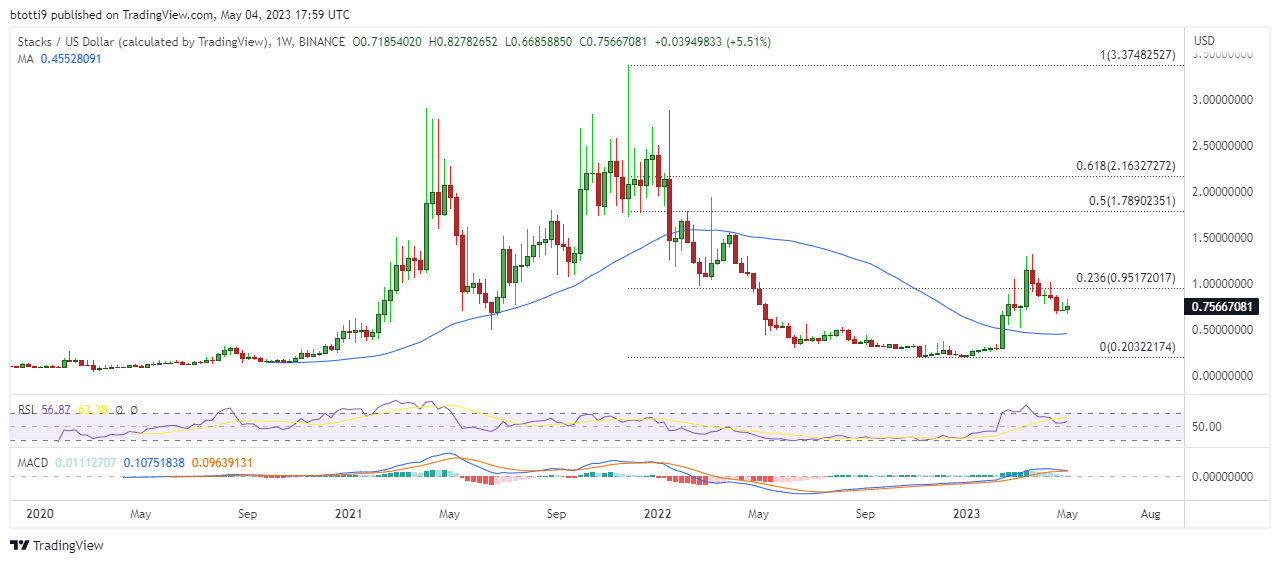 Chart showing the price movement of Stacks (STX) with key technical indicators. Source: TradingViewAs shown above, the RSI indicator for STX on is currently at 57. This suggests that STX is largely neutral, indicating its neither oversold nor overbought.
However, the MACD indicator is suggesting a potential bearish crossover. We can see the MACD line is above the signal line but could cross below to give the advantage to the bears.
Meanwhile, the main barrier to the upside is likely to be at the Fibonacci retracement level at 23.6% that marks the retracement of the last swing from the highs of $3.37 to lows of $0.20. That level is currently around $0.95. Stacks also highlight the 50% and 61.8% retracement levels as main resistance areas.
In case the Stacks (STX) price continues its downward trend, the first support level could be at a long-term horizontal line near $0.45. The 50-week moving average line is currently leveling up around this area, while the $0.20 demand reload line provides a key buffer zone.
[ad_2]
Source link