 Downtrend: Predicting Bottom Price")
[ad_1]
The Bitcoin Cash (BCH) price has fallen since reaching a new yearly high on June 30. However, it shows signs that the correction is complete.
Up until now, the price of BCH has surged by an impressive 175% without only minimal pullback. The short-term readings indicate that the correction may be complete, and the price will immediately resume its upward movement.
BCH Price Consolidates Below Long-Term Resistance
The technical analysis for the weekly time frame shows that the BCH price has been under a long-term descending resistance line since May 2021. During this period, BCH reached a low of $86, which was slightly higher than its all-time low of $81 in December 2018.
Nevertheless, the BCH price has shown significant growth since then. In January 2023, it broke out from the descending resistance line that had been in place for 609 days.
Although BCH briefly returned to its pre-breakout levels in June, it rebounded strongly after forming a double bottom pattern (green icons), considered a bullish sign that often leads to notable upward movements. As a result, the BCH price has increased by approximately 175% since the double bottom formation.
BCH is trading just below the $285 area, and the market’s response to this level is crucial for determining its future trend.
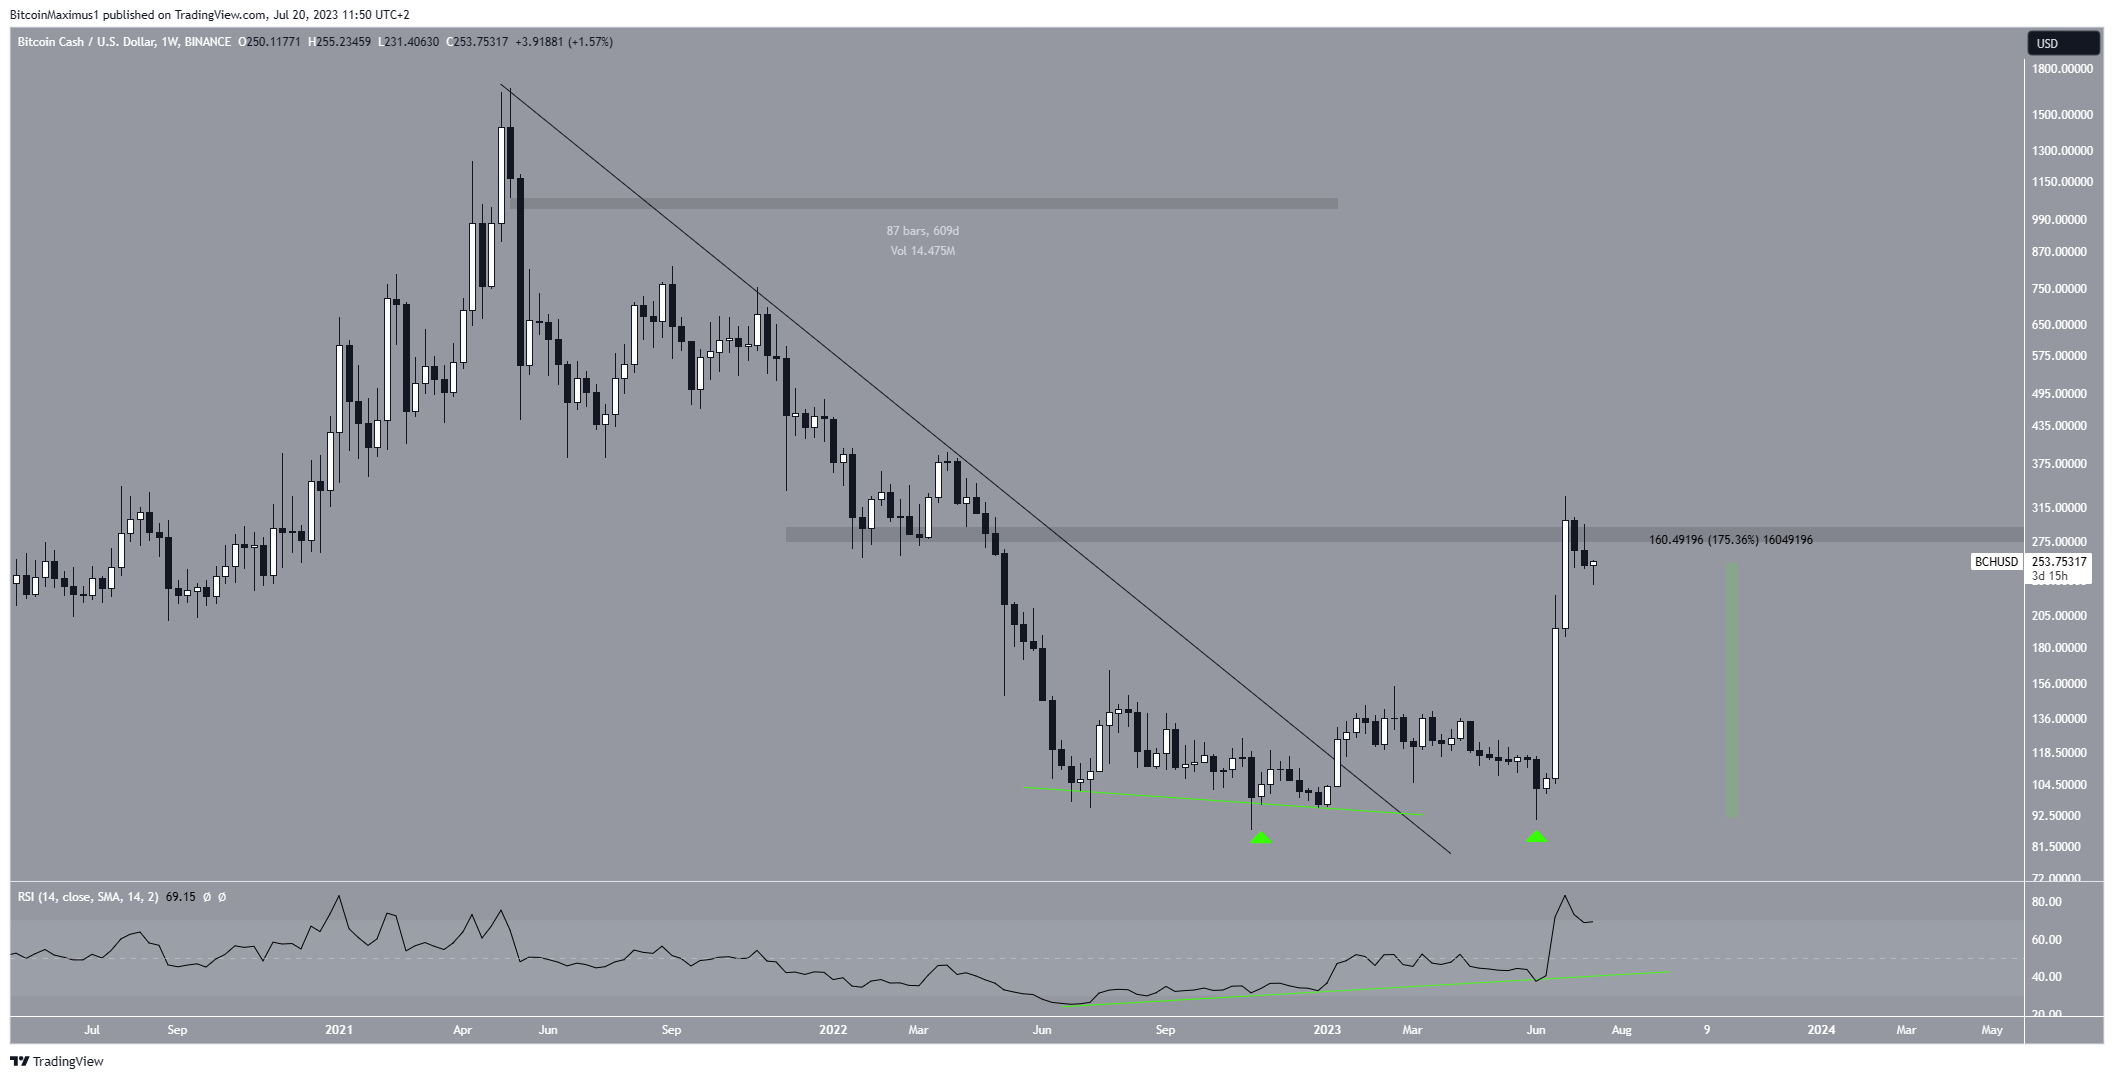
The weekly RSI supports the continuation of this price increase. RSI is a momentum indicator used by traders to assess whether a market is overbought or oversold and to determine whether to buy or sell an asset.
Readings above 50 and an upward trend indicate that the bulls have an advantage, while readings below 50 suggest the opposite. In this case, the RSI is above 50 and rising, both of which are signs of a bullish trend.
A bullish divergence (green line) preceded the entire upward movement. This is another positive sign that is associated with bullish trend reversals, granting legitimacy to the increase.
BCH Price Prediction: Wave Count Suggests Correction is Complete
Looking at the shorter-term daily time frame, there is a positive outlook because of the wave count.
In the long term, the wave count indicates a strong bullish trend. Analysts who use the Elliott Wave theory study repetitive long-term price patterns and investor psychology to determine the trend’s direction.
Due to the significant surge, the wave count suggests that the current BCH price has begun a five-wave upward movement (white). In it, the third wave extended.
On July 18, the price bounced at the 0.382 Fib retracement support level (black). The principle behind Fibonacci retracement levels suggests that after a considerable price movement in one direction, the price will retrace or go back partially to a previous price level before continuing in its original direction. The 0.382 level is where wave four commonly ends.
If the count is correct, the BCH price will complete wave five between $380-$390, an area created by the 4.21 extension of wave one (white) and the 1.61 external retracements of wave four (red).
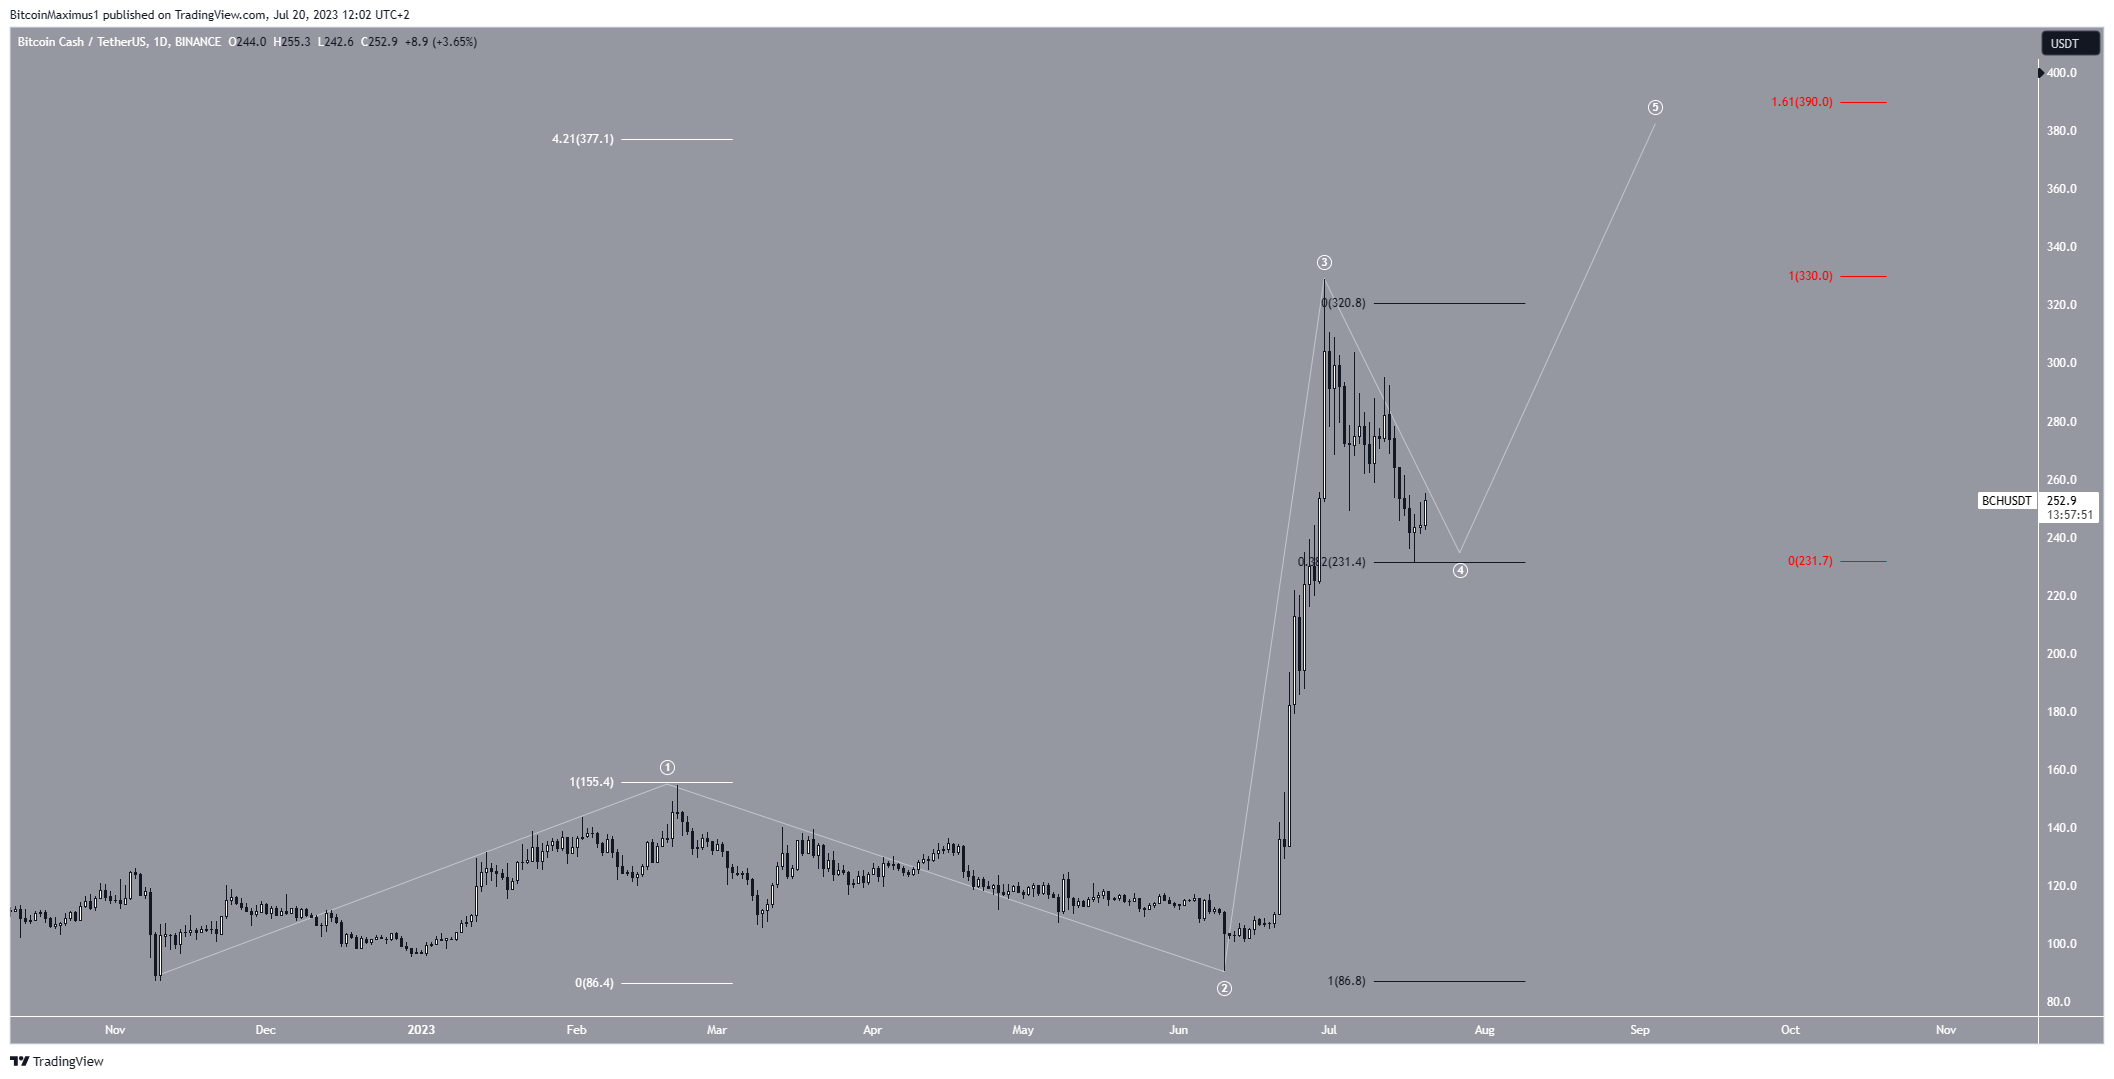
Despite this bullish BCH price prediction, falling below $233 will mean that the trend is still bearish. In that case, a drop to $200 will be expected.
For BeInCrypto’s latest crypto market analysis, click here.
Disclaimer
In line with the Trust Project guidelines, this price analysis article is for informational purposes only and should not be considered financial or investment advice. BeInCrypto is committed to accurate, unbiased reporting, but market conditions are subject to change without notice. Always conduct your own research and consult with a professional before making any financial decisions.
[ad_2]
Source link
Be the first to comment